IN WESTERN AUSTRALIA - Department of Mines and Petroleum
IN WESTERN AUSTRALIA - Department of Mines and Petroleum
IN WESTERN AUSTRALIA - Department of Mines and Petroleum

You also want an ePaper? Increase the reach of your titles
YUMPU automatically turns print PDFs into web optimized ePapers that Google loves.
station. However, for conventional MT recording<br />
these models generally lack the resolution needed<br />
for accurate prospect delineation.<br />
In addition to the primary frequencies induced in the<br />
telluric currents, higher order harmonic energy is<br />
also generated. The audio frequency magnetotelluric<br />
(AMT) technique varies from conventional MT by<br />
attempting to analyse the higher frequency<br />
harmonics <strong>of</strong> the recognised lower frequency carrier<br />
waves that propagate within the earth. As with<br />
conventional MT, the final output is a pseudoresistivity<br />
curve but with greater vertical resolution.<br />
These plots, when compared to wireline data from<br />
wellbores, <strong>of</strong>ten show a good correlation with a self<br />
potential (SP) log. In addition, the phase component<br />
within low resistivity (i.e. porous) zones may be<br />
further analysed for phase distortions considered<br />
typical <strong>of</strong> hydrocarbon pore saturation. Because the<br />
frequencies <strong>of</strong> the data are in the audio frequency<br />
range, the analogue signal can be listened to by an<br />
experienced operator in the same manner as used<br />
by a trained sonar operator <strong>and</strong> then categorised as<br />
being strongly or weakly typical <strong>of</strong> water, gas or oil.<br />
Computer s<strong>of</strong>tware to try to perform this task<br />
digitally has been written but it is currently not as<br />
good. The scientific validity <strong>of</strong> this technique is not<br />
theoretically proven but even where these ‘shows’<br />
are not definitive they are <strong>of</strong>ten useful in correlating<br />
responses from one station to another.<br />
The Canning Basin<br />
The first MT survey for petroleum exploration in WA<br />
was conducted in the central Canning Basin for Elf<br />
Aquitaine in 1968. It was a fairly extensive<br />
conventional MT survey, which provided useful<br />
information about the basin structure <strong>and</strong> sediment<br />
thickness in the area <strong>of</strong> the survey.<br />
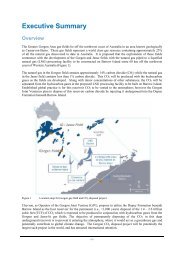
The second survey in the Canning Basin was an<br />
AMT survey conducted by Digital Magneto-telluric<br />
Technologies (DMT) for Kingsway Resources 2001<br />
to help evaluate the Sally May prospect (formerly<br />
known as Cetus) in 2003. This prospect is a large<br />
Ordovician sub-salt play with 4-way dip closure<br />
previously identified from both a seismic grid <strong>and</strong><br />
from an aeromagnetic survey. The MT survey<br />
comprised approximately 20 recordings over the<br />
prospect plus calibration recordings at two <strong>of</strong>fset<br />
wells; Looma 1, which discovered oil at the main<br />
prospective reservoir levels <strong>and</strong> Fruitcake 1, which<br />
is the closest well to the prospect. The survey<br />
produced results that closely matched data from the<br />
wells <strong>and</strong> provided information on the depth<br />
structure <strong>of</strong> the prospect, likely reservoir quality,<br />
thickness <strong>and</strong> fluid fill. Looma 1 encountered oil in<br />
six zones, 3 zones in the Nita Formation carbonate<br />
section <strong>and</strong> 3 in the deeper Acacia Formation<br />
s<strong>and</strong>stone. All zones correctly were predicted from<br />
analysis <strong>of</strong> the MT data without detailed prior<br />
knowledge. Looma 1 did not flow oil to surface due<br />
to very poor permeability in the reservoir sections.<br />
Fruitcake 1 was an unsuccessful test <strong>of</strong> a shallow<br />
(post-salt) play type.<br />
The crest <strong>of</strong> the structure identified from two<br />
perpendicular lines <strong>of</strong> MT recordings more closely<br />
matched the result predicted from the aeromagnetic<br />
survey than that previously interpreted from the<br />
seismic survey. The seismic data interpretation was<br />
severely affected by velocity variations due to<br />
varying salt thickness <strong>and</strong> also infilled eroded<br />
channels at the top <strong>of</strong> the salt. The MT data predicts<br />
a 45 m oil column at the structurally highest point<br />
recorded. The Sally May prospect is likely to be<br />
drilled in 2004.<br />
The Carnarvon Basin<br />
Three separate MT surveys were carried out in this<br />
basin, mainly focussed on the Rough Range <strong>and</strong><br />
Giralia anticlines.<br />
In 1999-2000, Empire Oil & Gas carried out<br />
technical work to appraise the Rough Range oilfield,<br />
culminating in the drilling <strong>of</strong> Rough Range 1B <strong>and</strong><br />
Central Rough Range 1. The Rough Range anticline<br />
was formed by Miocene aged compressional<br />
reactivation <strong>of</strong> the Rough Range fault (a major<br />
Jurassic fault). A small oil accumulation exists within<br />
the Early Cretaceous Birdrong S<strong>and</strong>stone at the<br />
crest <strong>of</strong> the anticline. Since the accumulation is far<br />
from being filled to spill, it is likely to have remigrated<br />
from a nearby accumulation following the<br />
Miocene compression. The anticline is easily<br />
observable at the surface that comprises weathered<br />
Miocene aged Trealla Limestone. The recent<br />
weathering <strong>of</strong> the Trealla carbonates has resulted in<br />
rapid near-surface velocity variations, which badly<br />
affect the seismic data recorded over the anticline.<br />
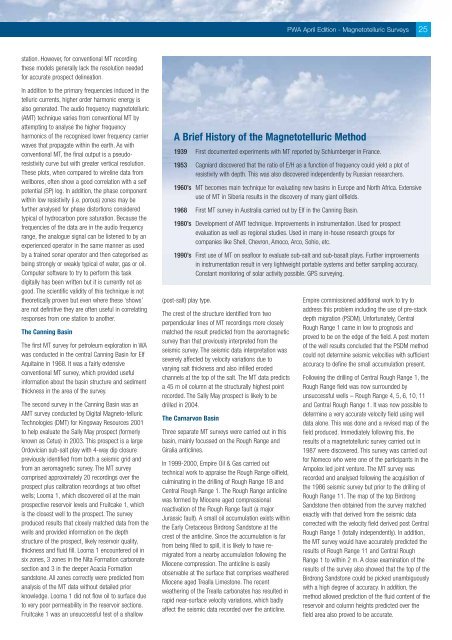
PWA April Edition - Magnetotelluric Surveys 25<br />
A Brief History <strong>of</strong> the Magnetotelluric Method<br />
1939 First documented experiments with MT reported by Schlumberger in France.<br />
1953 Cagniard discovered that the ratio <strong>of</strong> E/H as a function <strong>of</strong> frequency could yield a plot <strong>of</strong><br />
resistivity with depth. This was also discovered independently by Russian researchers.<br />
1960’s MT becomes main technique for evaluating new basins in Europe <strong>and</strong> North Africa. Extensive<br />
use <strong>of</strong> MT in Siberia results in the discovery <strong>of</strong> many giant oilfields.<br />
1968 First MT survey in Australia carried out by Elf in the Canning Basin.<br />
1980’s Development <strong>of</strong> AMT technique. Improvements in instrumentation. Used for prospect<br />
evaluation as well as regional studies. Used in many in-house research groups for<br />
companies like Shell, Chevron, Amoco, Arco, Sohio, etc.<br />
1990’s First use <strong>of</strong> MT on seafloor to evaluate sub-salt <strong>and</strong> sub-basalt plays. Further improvements<br />
in instrumentation result in very lightweight portable systems <strong>and</strong> better sampling accuracy.<br />
Constant monitoring <strong>of</strong> solar activity possible. GPS surveying.<br />
Empire commissioned additional work to try to<br />
address this problem including the use <strong>of</strong> pre-stack<br />
depth migration (PSDM). Unfortunately, Central<br />
Rough Range 1 came in low to prognosis <strong>and</strong><br />
proved to be on the edge <strong>of</strong> the field. A post mortem<br />
<strong>of</strong> the well results concluded that the PSDM method<br />
could not determine seismic velocities with sufficient<br />
accuracy to define the small accumulation present.<br />
Following the drilling <strong>of</strong> Central Rough Range 1, the<br />
Rough Range field was now surrounded by<br />
unsuccessful wells – Rough Range 4, 5, 6, 10, 11<br />
<strong>and</strong> Central Rough Range 1. It was now possible to<br />
determine a very accurate velocity field using well<br />
data alone. This was done <strong>and</strong> a revised map <strong>of</strong> the<br />
field produced. Immediately following this, the<br />
results <strong>of</strong> a magnetotelluric survey carried out in<br />
1987 were discovered. This survey was carried out<br />
for Nomeco who were one <strong>of</strong> the participants in the<br />
Ampolex led joint venture. The MT survey was<br />
recorded <strong>and</strong> analysed following the acquisition <strong>of</strong><br />
the 1986 seismic survey but prior to the drilling <strong>of</strong><br />
Rough Range 11. The map <strong>of</strong> the top Birdrong<br />
S<strong>and</strong>stone then obtained from the survey matched<br />
exactly with that derived from the seismic data<br />
corrected with the velocity field derived post Central<br />
Rough Range 1 (totally independently). In addition,<br />
the MT survey would have accurately predicted the<br />
results <strong>of</strong> Rough Range 11 <strong>and</strong> Central Rough<br />
Range 1 to within 2 m. A close examination <strong>of</strong> the<br />
results <strong>of</strong> the survey also showed that the top <strong>of</strong> the<br />
Birdrong S<strong>and</strong>stone could be picked unambiguously<br />
with a high degree <strong>of</strong> accuracy. In addition, the<br />
method allowed prediction <strong>of</strong> the fluid content <strong>of</strong> the<br />
reservoir <strong>and</strong> column heights predicted over the<br />
field area also proved to be accurate.