

The Relationship Between The 1990 Census and ... - Census Bureau
The Relationship Between The 1990 Census and ... - Census Bureau
The Relationship Between The 1990 Census and ... - Census Bureau

You also want an ePaper? Increase the reach of your titles
YUMPU automatically turns print PDFs into web optimized ePapers that Google loves.
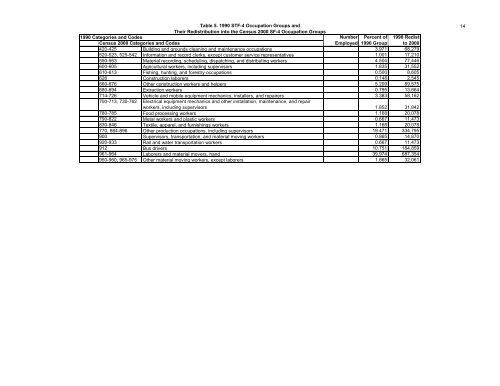
Table 5. <strong>1990</strong> STF-4 Occupation Groups <strong>and</strong><br />
<strong>The</strong>ir Redistribution into the <strong>Census</strong> 2000 SF-4 Occupation Groups<br />
<strong>1990</strong> Categories <strong>and</strong> Codes Number Percent of <strong>1990</strong> Redist<br />
<strong>Census</strong> 2000 Categories <strong>and</strong> Codes<br />
Employed <strong>1990</strong> Group to 2000<br />
420-425 Building <strong>and</strong> grounds cleaning <strong>and</strong> maintenance occupations 3.971 68,279<br />
520-523, 525-542 Information <strong>and</strong> record clerks, except customer service representatives 1.001 17,210<br />
550-563 Material recording, scheduling, dispatching, <strong>and</strong> distributing workers 4.504 77,446<br />
600-605 Agricultural workers, including supervisors 1.835 31,552<br />
610-613 Fishing, hunting, <strong>and</strong> forestry occupations 0.500 8,605<br />
626 Construction laborers 0.148 2,545<br />
660-676 Other construction workers <strong>and</strong> helpers 5.209 89,575<br />
680-694 Extraction workers 0.795 13,664<br />
714-726 Vehicle <strong>and</strong> mobile equipment mechanics, installers, <strong>and</strong> repairers 3.383 58,162<br />
700-713, 730-762 Electrical equipment mechanics <strong>and</strong> other installation, maintenance, <strong>and</strong> repair<br />
workers, including supervisors 1.852 31,842<br />
780-785 Food processing workers 1.168 20,078<br />
790-822 Metal workers <strong>and</strong> plastic workers 0.667 11,473<br />
830-846 Textile, apparel, <strong>and</strong> furnishings workers 1.168 20,078<br />
770, 864-896 Other production occupations, including supervisors 19.471 334,795<br />
900 Supervisors, transportation, <strong>and</strong> material moving workers 0.865 14,870<br />
920-933 Rail <strong>and</strong> water transportation workers 0.667 11,473<br />
912 Bus drivers 10.751 184,859<br />
961-964 Laborers <strong>and</strong> material movers, h<strong>and</strong> 39.974 687,354<br />
950-960, 965-975 Other material moving workers, except laborers 1.865 32,061<br />
14


