

The Relationship Between The 1990 Census and ... - Census Bureau
The Relationship Between The 1990 Census and ... - Census Bureau
The Relationship Between The 1990 Census and ... - Census Bureau

You also want an ePaper? Increase the reach of your titles
YUMPU automatically turns print PDFs into web optimized ePapers that Google loves.
<strong>1990</strong> <strong>Census</strong> Codes <strong>and</strong> Categories<br />
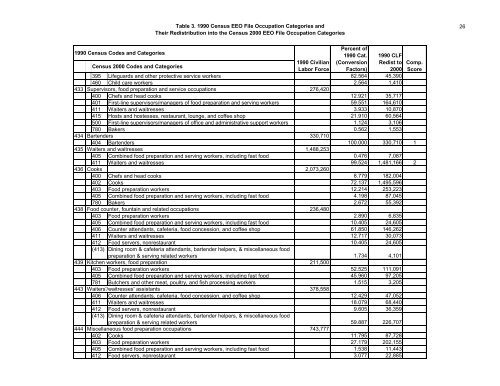
Table 3. <strong>1990</strong> <strong>Census</strong> EEO File Occupation Categories <strong>and</strong><br />
<strong>The</strong>ir Redistribution into the <strong>Census</strong> 2000 EEO File Occupation Categories<br />
Percent of<br />
<strong>1990</strong> Cat.<br />
(Conversion<br />
Factors)<br />
<strong>1990</strong> CLF<br />
Redist to<br />
2000<br />
<strong>Census</strong> 2000 Codes <strong>and</strong> Categories<br />
<strong>1990</strong> Civilian<br />
Labor Force<br />
395 Lifeguards <strong>and</strong> other protective service workers 82.564 45,390<br />
460 Child care workers 2.564 1,410<br />
433 Supervisors, food preparation <strong>and</strong> service occupations 276,420<br />
400 Chefs <strong>and</strong> head cooks 12.921 35,717<br />
401 First-line supervisors/managers of food preparation <strong>and</strong> serving workers 59.551 164,610<br />
411 Waiters <strong>and</strong> waitresses 3.933 10,870<br />
415 Hosts <strong>and</strong> hostesses, restaurant, lounge, <strong>and</strong> coffee shop 21.910 60,564<br />
500 First-line supervisors/managers of office <strong>and</strong> administrative support workers 1.124 3,106<br />
780 Bakers 0.562 1,553<br />
434 Bartenders 330,710<br />
404 Bartenders 100.000 330,710 1<br />
435 Waiters <strong>and</strong> waitresses 1,488,253<br />
405 Combined food preparation <strong>and</strong> serving workers, including fast food 0.476 7,087<br />
411 Waiters <strong>and</strong> waitresses 99.524 1,481,166 2<br />
436 Cooks 2,073,260<br />
400 Chefs <strong>and</strong> head cooks 8.779 182,004<br />
402 Cooks 72.137 1,495,596<br />
403 Food preparation workers 12.214 253,223<br />
405 Combined food preparation <strong>and</strong> serving workers, including fast food 4.198 87,045<br />
780 Bakers 2.672 55,392<br />
438 Food counter, fountain <strong>and</strong> related occupations 236,480<br />
403 Food preparation workers 2.890 6,835<br />
405 Combined food preparation <strong>and</strong> serving workers, including fast food 10.405 24,605<br />
406 Counter attendants, cafeteria, food concession, <strong>and</strong> coffee shop 61.850 146,262<br />
411 Waiters <strong>and</strong> waitresses 12.717 30,073<br />
412 Food servers, nonrestaurant 10.405 24,605<br />
(413) Dining room & cafeteria attendants, bartender helpers, & miscellaneous food<br />
preparation & serving related workers 1.734 4,101<br />
439 Kitchen workers, food preparation 211,500<br />
403 Food preparation workers 52.525 111,091<br />
405 Combined food preparation <strong>and</strong> serving workers, including fast food 45.960 97,205<br />
781 Butchers <strong>and</strong> other meat, poultry, <strong>and</strong> fish processing workers 1.515 3,205<br />
443 Waiters'/waitresses' assistants 378,558<br />
406 Counter attendants, cafeteria, food concession, <strong>and</strong> coffee shop 12.429 47,052<br />
411 Waiters <strong>and</strong> waitresses 18.079 68,440<br />
412 Food servers, nonrestaurant 9.605 36,359<br />
(413) Dining room & cafeteria attendants, bartender helpers, & miscellaneous food<br />
preparation & serving related workers 59.887 226,707<br />
444 Miscellaneous food preparation occupations 743,777<br />
402 Cooks 11.795 87,728<br />
403 Food preparation workers 27.179 202,155<br />
405 Combined food preparation <strong>and</strong> serving workers, including fast food 1.538 11,443<br />
412 Food servers, nonrestaurant 3.077 22,885<br />
Comp.<br />
Score<br />
26


