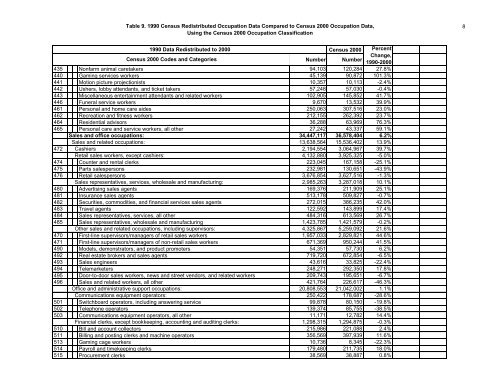
Table 9. <strong>1990</strong> <strong>Census</strong> Redistributed Occupation Data Compared to <strong>Census</strong> 2000 Occupation Data, Using the <strong>Census</strong> 2000 Occupation Classification <strong>1990</strong> Data Redistributed to 2000 <strong>Census</strong> 2000 Percent <strong>Census</strong> 2000 Codes <strong>and</strong> Categories Number Number Change, <strong>1990</strong>-2000 435 Nonfarm animal caretakers 94,103 120,284 27.8% 440 Gaming services workers 45,139 90,872 101.3% 441 Motion picture projectionists 10,357 10,113 -2.4% 442 Ushers, lobby attendants, <strong>and</strong> ticket takers 57,248 57,030 -0.4% 443 Miscellaneous entertainment attendants <strong>and</strong> related workers 102,905 145,852 41.7% 446 Funeral service workers 9,670 13,532 39.9% 461 Personal <strong>and</strong> home care aides 250,063 307,516 23.0% 462 Recreation <strong>and</strong> fitness workers 212,155 262,392 23.7% 464 Residential advisors 36,288 63,969 76.3% 465 Personal care <strong>and</strong> service workers, all other 27,242 43,337 59.1% Sales <strong>and</strong> office occupations: 34,447,117 36,578,404 6.2% Sales <strong>and</strong> related occupations: 13,638,564 15,536,402 13.9% 472 Cashiers 2,194,554 3,064,967 39.7% Retail sales workers, except cashiers: 4,132,880 3,925,325 -5.0% 474 Counter <strong>and</strong> rental clerks 223,045 167,158 -25.1% 475 Parts salespersons 232,981 130,651 -43.9% 476 Retail salespersons 3,676,854 3,627,516 -1.3% Sales representatives, services, wholesale <strong>and</strong> manufacturing: 2,985,263 3,287,018 10.1% 480 Advertising sales agents 169,376 211,909 25.1% 481 Insurance sales agents 513,178 509,827 -0.7% 482 Securities, commodities, <strong>and</strong> financial services sales agents 272,015 386,235 42.0% 483 Travel agents 122,592 143,899 17.4% 484 Sales representatives, services, all other 484,316 613,569 26.7% 485 Sales representatives, wholesale <strong>and</strong> manufacturing 1,423,785 1,421,579 -0.2% Other sales <strong>and</strong> related occupations, including supervisors: 4,325,867 5,259,092 21.6% 470 First-line supervisors/managers of retail sales workers 1,957,033 2,829,821 44.6% 471 First-line supervisors/managers of non-retail sales workers 671,369 950,244 41.5% 490 Models, demonstrators, <strong>and</strong> product promoters 54,351 57,730 6.2% 492 Real estate brokers <strong>and</strong> sales agents 719,720 672,854 -6.5% 493 Sales engineers 43,616 33,825 -22.4% 494 Telemarketers 248,271 292,350 17.8% 495 Door-to-door sales workers, news <strong>and</strong> street vendors, <strong>and</strong> related workers 209,743 195,651 -6.7% 496 Sales <strong>and</strong> related workers, all other 421,764 226,617 -46.3% Office <strong>and</strong> administrative support occupations: 20,808,553 21,042,002 1.1% Communications equipment operators: 250,422 178,687 -28.6% 501 Switchboard operators, including answering service 99,878 80,150 -19.8% 502 Telephone operators 139,374 85,755 -38.5% 503 Communications equipment operators, all other 11,171 12,782 14.4% Financial clerks, except bookkeeping, accounting <strong>and</strong> auditing clerks: 1,298,315 1,294,875 -0.3% 510 Bill <strong>and</strong> account collectors 215,986 221,088 2.4% 511 Billing <strong>and</strong> posting clerks <strong>and</strong> machine operators 356,569 397,939 11.6% 513 Gaming cage workers 10,736 8,345 -22.3% 514 Payroll <strong>and</strong> timekeeping clerks 179,480 211,735 18.0% 515 Procurement clerks 38,569 38,887 0.8% 8
Table 9. <strong>1990</strong> <strong>Census</strong> Redistributed Occupation Data Compared to <strong>Census</strong> 2000 Occupation Data, Using the <strong>Census</strong> 2000 Occupation Classification <strong>1990</strong> Data Redistributed to 2000 <strong>Census</strong> 2000 Percent <strong>Census</strong> 2000 Codes <strong>and</strong> Categories Number Number Change, <strong>1990</strong>-2000 516 Tellers 496,975 416,881 -16.1% 512 Bookkeeping, accounting, <strong>and</strong> auditing clerks 1,795,444 1,758,891 -2.0% Information <strong>and</strong> record clerks, except customer service representatives: 2,484,859 2,868,383 15.4% 520 Brokerage clerks 6,482 10,583 63.3% 522 Court, municipal, <strong>and</strong> license clerks 95,155 77,063 -19.0% 523 Credit authorizers, checkers, <strong>and</strong> clerks 64,463 55,092 -14.5% 525 Eligibility interviewers, government programs 58,124 63,355 9.0% 526 File Clerks 342,299 345,446 0.9% 530 Hotel, motel, <strong>and</strong> resort desk clerks 80,033 122,367 52.9% 531 Interviewers, except eligibility <strong>and</strong> loan 214,745 224,019 4.3% 532 Library assistants, clerical 109,758 156,282 42.4% 533 Loan interviewers <strong>and</strong> clerks 76,564 117,256 53.1% 534 New accounts clerks 11,636 16,710 43.6% (535) Correspondence clerks <strong>and</strong> order clerks: 171,112 189,409 10.7% 521 Correspondence clerks 12,521 8,255 -34.1% 535 Order clerks 158,591 181,154 14.2% 536 Human resources assistants, except payroll <strong>and</strong> timekeeping 58,953 55,497 -5.9% 540 Receptionists <strong>and</strong> information clerks 997,372 1,159,828 16.3% 541 Reservation <strong>and</strong> transportation ticket agents <strong>and</strong> travel clerks 165,664 194,310 17.3% 542 Information <strong>and</strong> record clerks, all other 32,498 81,166 149.8% 524 Customer service representatives 745,475 2,111,319 183.2% Material recording, scheduling, dispatching, <strong>and</strong> distributing workers: 3,499,908 3,616,082 3.3% 550 Cargo <strong>and</strong> freight agents 34,592 20,105 -41.9% 551 Couriers <strong>and</strong> messengers 150,463 203,547 35.3% 552 Dispatchers 214,190 256,413 19.7% 553 Meter readers, utilities 49,536 43,401 -12.4% 554 Postal service clerks 236,846 165,513 -30.1% 555 Postal service mail carriers 330,136 354,393 7.3% 556 Postal service mail sorters, processors, <strong>and</strong> processing machine operators 147,806 129,399 -12.5% 560 Production, planning, <strong>and</strong> expediting clerks 358,239 342,280 -4.5% 561 Shipping, receiving, <strong>and</strong> traffic clerks 569,958 672,165 17.9% 562 Stock clerks <strong>and</strong> order fillers 1,319,284 1,347,947 2.2% 563 Weighers, measurers, checkers, <strong>and</strong> samplers, recordkeeping 88,856 80,919 -8.9% 570 Secretaries <strong>and</strong> administrative assistants 4,308,804 3,858,937 -10.4% Other office <strong>and</strong> administrative support workers, including supervisors: 6,425,327 5,354,828 -16.7% 500 First-line supervisors/managers of office <strong>and</strong> administrative support workers 2,017,755 1,721,232 -14.7% 580 Computer operators 666,727 268,996 -59.7% 581 Data entry keyers 632,428 637,411 0.8% 582 Word processors <strong>and</strong> typists 658,235 188,686 -71.3% 583 Desktop publishers 5,779 15,186 162.8% 584 Insurance claims <strong>and</strong> policy processing clerks 130,075 220,326 69.4% 585 Mail clerks <strong>and</strong> mail machine operators, except postal service 209,512 170,521 -18.6% 586 Office clerks, general 1,446,559 1,491,877 3.1% 590 Office machine operators, except computer 103,657 64,888 -37.4% 9
- Page 1 and 2:
The Relationship Between The 1990 C
- Page 3 and 4:
TABLE OF CONTENTS Technical Report:
- Page 5 and 6:
The Relationship Between the 1990 C
- Page 7 and 8:
After 1990, however, the crosswalks
- Page 9 and 10:
entertainment, and recreation,”
- Page 11 and 12:
apply those factors to census data
- Page 13 and 14:
“majority” choice in most cases
- Page 15 and 16:
went to category 340, “Emergency
- Page 17 and 18:
Industry 1. Small, new, and residua
- Page 19 and 20:
The data presented in this report a
- Page 22 and 23:
1990 CENSUS CODE APPENDIX A. 1990 C
- Page 24 and 25:
CENSUS CODE MANUFACTURING - Continu
- Page 26 and 27:
CENSUS CODE RETAIL TRADE 580 Lumber
- Page 28:
CENSUS CODE PROFESSIONAL AND RELATE
- Page 31 and 32:
045 Metallurgical and materials (16
- Page 33 and 34:
Writers, Artists, Entertainers, and
- Page 35 and 36:
327 Order clerks (4664) 328 Personn
- Page 37 and 38:
457 Barbers (5252) 458 Hairdressers
- Page 39 and 40:
594 Paving, surfacing, and tamping
- Page 41 and 42:
749 Miscellaneous textile machine o
- Page 44 and 45:
APPENDIX C. CENSUS 2000 INDUSTRY CL
- Page 46 and 47:
Census 2000 1997 NAICS Code Categor
- Page 48 and 49:
Census 2000 1997 NAICS Code Categor
- Page 50:
Census 2000 1997 NAICS Code Categor
- Page 53 and 54:
Census 2000 2000 SOC Code Category
- Page 55 and 56:
Census 2000 2000 SOC Code Category
- Page 57 and 58:
Census 2000 2000 SOC Code Category
- Page 59 and 60:
Census 2000 2000 SOC Code Category
- Page 61 and 62:
Census 2000 2000 SOC Code Category
- Page 64 and 65:
APPENDIX E. BIBLIOGRAPHY OF RELATED
- Page 66 and 67:
APPENDIX G. GLOSSARY OF TERMS AND A
- Page 68 and 69:
Industry and Occupation The 1990 ce
- Page 70 and 71:
1990 Census Codes and Categories Ce
- Page 72 and 73:
1990 Census Codes and Categories Ce
- Page 74 and 75:
1990 Census Codes and Categories Ce
- Page 76 and 77:
1990 Census Codes and Categories Ce
- Page 78 and 79:
1990 Census Codes and Categories Ce
- Page 80 and 81:
1990 Census Codes and Categories Ta
- Page 82 and 83:
1990 Census Codes and Categories Ce
- Page 84 and 85:
1990 Census Codes and Categories Ce
- Page 86 and 87:
1990 Census Codes and Categories Ce
- Page 88 and 89:
1990 Census Codes and Categories Ce
- Page 90 and 91:
1990 Census Codes and Categories Ce
- Page 92 and 93:
Table 2. 1990 Census Occupation Cla
- Page 94 and 95:
1990 Census Codes and Categories Ce
- Page 96 and 97:
1990 Census Codes and Categories Ce
- Page 98 and 99:
1990 Census Codes and Categories Ce
- Page 100 and 101:
1990 Census Codes and Categories Ce
- Page 102 and 103:
1990 Census Codes and Categories Ce
- Page 104 and 105:
1990 Census Codes and Categories Ce
- Page 106 and 107:
1990 Census Codes and Categories Ta
- Page 108 and 109:
1990 Census Codes and Categories Ce
- Page 110 and 111:
1990 Census Codes and Categories Ta
- Page 112 and 113:
1990 Census Codes and Categories Ce
- Page 114 and 115:
1990 Census Codes and Categories Ce
- Page 116 and 117:
1990 Census Codes and Categories Ce
- Page 118 and 119:
1990 Census Codes and Categories Ce
- Page 120 and 121:
1990 Census Codes and Categories Ce
- Page 122 and 123:
1990 Census Codes and Categories Ce
- Page 124 and 125:
1990 Census Codes and Categories Ta
- Page 126 and 127:
1990 Census Codes and Categories Ce
- Page 128 and 129:
1990 Census Codes and Categories Ce
- Page 130 and 131:
1990 Census Codes and Categories Ce
- Page 132 and 133:
1990 Census Codes and Categories Ce
- Page 134 and 135:
1990 Census Codes and Categories Ce
- Page 136 and 137:
1990 Census Codes and Categories Ce
- Page 138 and 139:
1990 Census Codes and Categories Ce
- Page 140 and 141:
1990 Census Codes and Categories Ce
- Page 142 and 143:
1990 Census Codes and Categories Ce
- Page 144 and 145:
Table 7. 1990 Census STF-3 Occupati
- Page 146 and 147:
Table 7. 1990 Census STF-3 Occupati
- Page 148 and 149:
Table 7. 1990 Census STF-3 Occupati
- Page 150 and 151:
Table 6. 1990 Census STF-3 Industry
- Page 152 and 153:
Table 6. 1990 Census STF-3 Industry
- Page 154 and 155:
Table 5. 1990 STF-4 Occupation Grou
- Page 156 and 157:
Table 5. 1990 STF-4 Occupation Grou
- Page 158 and 159:
Table 5. 1990 STF-4 Occupation Grou
- Page 160 and 161:
Table 5. 1990 STF-4 Occupation Grou
- Page 162 and 163:
Table 5. 1990 STF-4 Occupation Grou
- Page 164 and 165:
Table 5. 1990 STF-4 Occupation Grou
- Page 166 and 167:
Table 5. 1990 STF-4 Occupation Grou
- Page 168 and 169:
Table 4. 1990 STF-4 Industry Groups
- Page 170 and 171:
Table 4. 1990 STF-4 Industry Groups
- Page 172 and 173:
Table 4. 1990 STF-4 Industry Groups
- Page 174 and 175:
Table 4. 1990 STF-4 Industry Groups
- Page 176 and 177:
Table 4. 1990 STF-4 Industry Groups
- Page 178 and 179:
Table 3. 1990 Census EEO File Occup
- Page 180 and 181:
1990 Census Codes and Categories Ta
- Page 182 and 183:
1990 Census Codes and Categories Ta
- Page 184 and 185:
1990 Census Codes and Categories Ta
- Page 186 and 187:
1990 Census Codes and Categories Ta
- Page 188 and 189:
1990 Census Codes and Categories Ta
- Page 190 and 191:
1990 Census Codes and Categories Ta
- Page 192 and 193:
1990 Census Codes and Categories Ta
- Page 194 and 195: 1990 Census Codes and Categories Ta
- Page 196 and 197: 1990 Census Codes and Categories Ta
- Page 198 and 199: 1990 Census Codes and Categories Ta
- Page 200 and 201: 1990 Census Codes and Categories Ta
- Page 202 and 203: 1990 Census Codes and Categories Ta
- Page 204 and 205: 1990 Census Codes and Categories Ce
- Page 206 and 207: 1990 Census Codes and Categories Ta
- Page 208 and 209: 1990 Census Codes and Categories Ta
- Page 210 and 211: 1990 Census Codes and Categories Ta
- Page 212 and 213: 1990 Census Codes and Categories Ta
- Page 214 and 215: 1990 Census Codes and Categories Ta
- Page 216 and 217: 1990 Census Codes and Categories Ta
- Page 218 and 219: 1990 Census Codes and Categories Ce
- Page 220 and 221: 1990 Census Codes and Categories Ta
- Page 222 and 223: 1990 Census Codes and Categories Ta
- Page 224 and 225: 1990 Census Codes and Categories Ta
- Page 226 and 227: 1990 Census Codes and Categories Ta
- Page 228 and 229: 1990 Census Codes and Categories Ta
- Page 230 and 231: Table 8. 1990 Census Redistributed
- Page 232 and 233: Table 8. 1990 Census Redistributed
- Page 234 and 235: Table 8. 1990 Census Redistributed
- Page 236 and 237: Table 8. 1990 Census Redistributed
- Page 238 and 239: Table 9. 1990 Census Redistributed
- Page 240 and 241: Table 9. 1990 Census Redistributed
- Page 242 and 243: Table 9. 1990 Census Redistributed
- Page 246 and 247: Table 9. 1990 Census Redistributed
- Page 248 and 249: Table 9. 1990 Census Redistributed
- Page 250 and 251: Table 9. 1990 Census Redistributed
- Page 252 and 253: Table 10. 1990 Census Redistributed
- Page 254 and 255: Table 10. 1990 Census Redistributed
- Page 256 and 257: Table 11. 1990 Census Redistributed
- Page 258 and 259: Table 11. 1990 Census Redistributed
- Page 260 and 261: Template for Converting 1990 Census
- Page 262 and 263: Template for Converting 1990 Census
- Page 264 and 265: Template for Converting 1990 Census
- Page 266 and 267: Template for Converting 1990 Census