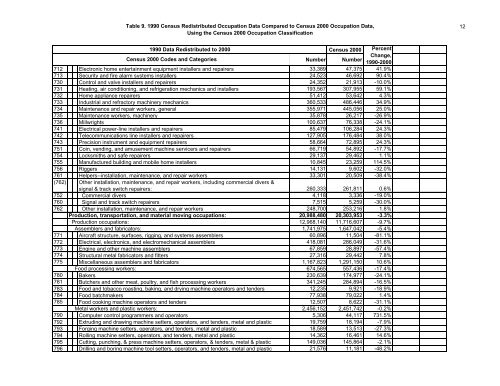
Table 9. <strong>1990</strong> <strong>Census</strong> Redistributed Occupation Data Compared to <strong>Census</strong> 2000 Occupation Data, Using the <strong>Census</strong> 2000 Occupation Classification <strong>1990</strong> Data Redistributed to 2000 <strong>Census</strong> 2000 Percent <strong>Census</strong> 2000 Codes <strong>and</strong> Categories Number Number Change, <strong>1990</strong>-2000 712 Electronic home entertainment equipment installers <strong>and</strong> repairers 33,389 47,375 41.9% 713 Security <strong>and</strong> fire alarm systems installers 24,523 46,692 90.4% 730 Control <strong>and</strong> valve installers <strong>and</strong> repairers 24,352 21,913 -10.0% 731 Heating, air conditioning, <strong>and</strong> refrigeration mechanics <strong>and</strong> installers 193,567 307,955 59.1% 732 Home appliance repairers 51,412 53,642 4.3% 733 Industrial <strong>and</strong> refractory machinery mechanics 360,533 486,446 34.9% 734 Maintenance <strong>and</strong> repair workers, general 355,971 445,056 25.0% 735 Maintenance workers, machinery 35,878 26,217 -26.9% 736 Millwrights 100,637 76,338 -24.1% 741 Electrical power-line installers <strong>and</strong> repairers 85,479 106,284 24.3% 742 Telecommunications line installers <strong>and</strong> repairers 127,905 176,484 38.0% 743 Precision instrument <strong>and</strong> equipment repairers 58,664 72,895 24.3% 751 Coin, vending, <strong>and</strong> amusement machine servicers <strong>and</strong> repairers 66,719 54,892 -17.7% 754 Locksmiths <strong>and</strong> safe repairers 29,137 29,462 1.1% 755 Manufactured building <strong>and</strong> mobile home installers 10,845 23,259 114.5% 756 Riggers 14,131 9,602 -32.0% 761 Helpers--installation, maintenance, <strong>and</strong> repair workers 33,301 20,509 -38.4% (762) Other installation, maintenance, <strong>and</strong> repair workers, including commercial divers & signal & track switch repairers: 260,333 261,811 0.6% 752 Commercial divers 4,118 3,336 -19.0% 760 Signal <strong>and</strong> track switch repairers 7,515 5,259 -30.0% 762 Other installation, maintenance, <strong>and</strong> repair workers 248,700 253,216 1.8% Production, transportation, <strong>and</strong> material moving occupations: 20,988,480 20,303,953 -3.3% Production occupations: 12,968,140 11,716,607 -9.7% Assemblers <strong>and</strong> fabricators: 1,741,975 1,647,042 -5.4% 771 Aircraft structure, surfaces, rigging, <strong>and</strong> systems assemblers 60,896 11,504 -81.1% 772 Electrical, electronics, <strong>and</strong> electromechanical assemblers 418,081 286,049 -31.6% 773 Engine <strong>and</strong> other machine assemblers 67,859 28,897 -57.4% 774 Structural metal fabricators <strong>and</strong> fitters 27,316 29,442 7.8% 775 Miscellaneous assemblers <strong>and</strong> fabricators 1,167,823 1,291,150 10.6% Food processing workers: 674,565 557,436 -17.4% 780 Bakers 230,639 174,977 -24.1% 781 Butchers <strong>and</strong> other meat, poultry, <strong>and</strong> fish processing workers 341,245 284,894 -16.5% 783 Food <strong>and</strong> tobacco roasting, baking, <strong>and</strong> drying machine operators <strong>and</strong> tenders 12,235 9,921 -18.9% 784 Food batchmakers 77,938 79,022 1.4% 785 Food cooking machine operators <strong>and</strong> tenders 12,507 8,622 -31.1% Metal workers <strong>and</strong> plastic workers: 2,456,152 2,451,742 -0.2% 790 Computer control programmers <strong>and</strong> operators 5,306 44,117 731.5% 792 Extruding <strong>and</strong> drawing machine setters, operators, <strong>and</strong> tenders, metal <strong>and</strong> plastic 19,759 18,194 -7.9% 793 Forging machine setters, operators, <strong>and</strong> tenders, metal <strong>and</strong> plastic 18,589 13,513 -27.3% 794 Rolling machine setters, operators, <strong>and</strong> tenders, metal <strong>and</strong> plastic 14,362 16,461 14.6% 795 Cutting, punching, & press machine setters, operators, & tenders, metal & plastic 149,036 145,864 -2.1% 796 Drilling <strong>and</strong> boring machine tool setters, operators, <strong>and</strong> tenders, metal <strong>and</strong> plastic 21,576 11,181 -48.2% 12
Table 9. <strong>1990</strong> <strong>Census</strong> Redistributed Occupation Data Compared to <strong>Census</strong> 2000 Occupation Data, Using the <strong>Census</strong> 2000 Occupation Classification <strong>1990</strong> Data Redistributed to 2000 <strong>Census</strong> 2000 Percent <strong>Census</strong> 2000 Codes <strong>and</strong> Categories Number Number Change, <strong>1990</strong>-2000 800 Grinding, lapping, polishing, <strong>and</strong> buffing machine tool setters, operators, <strong>and</strong> tenders, metal <strong>and</strong> plastic 100,943 86,650 -14.2% 801 Lathe <strong>and</strong> turning machine tool setters, operators, <strong>and</strong> tenders, metal <strong>and</strong> plastic 40,494 19,631 -51.5% 803 Machinists 564,910 497,641 -11.9% 804 Metal furnace <strong>and</strong> kiln operators <strong>and</strong> tenders 54,633 35,871 -34.3% 806 Model makers <strong>and</strong> patternmakers, metal <strong>and</strong> plastic 18,290 16,105 -11.9% 810 Molders <strong>and</strong> molding machine setters, operators, <strong>and</strong> tenders, metal <strong>and</strong> plastic 98,231 99,465 1.3% 813 Tool <strong>and</strong> die makers 146,176 121,748 -16.7% 814 Welding, soldering, <strong>and</strong> brazing workers 669,119 648,773 -3.0% 815 Heat treating equipment setters, operators, <strong>and</strong> tenders, metal <strong>and</strong> plastic 18,206 12,544 -31.1% 816 Lay-out workers, metal <strong>and</strong> plastic 18,702 10,711 -42.7% 820 Plating <strong>and</strong> coating machine setters, operators, <strong>and</strong> tenders, metal <strong>and</strong> plastic 37,182 24,751 -33.4% 821 Tool grinders, filers, <strong>and</strong> sharpeners 24,721 13,755 -44.4% (822) Other metalworkers <strong>and</strong> plastic workers: 435,916 614,767 41.0% 802 Milling <strong>and</strong> planing machine setters, operators, <strong>and</strong> tenders, metal <strong>and</strong> plastic 6,789 3,405 -49.8% 812 Multiple machine tool setters, operators, <strong>and</strong> tenders, metal <strong>and</strong> plastic 2,456 7,870 220.4% 822 Metalworkers <strong>and</strong> plastic workers, all other 426,671 603,492 41.4% Printing workers: 604,849 430,598 -28.8% 823 Bookbinders <strong>and</strong> bindery workers 64,781 51,903 -19.9% 824 Job printers 85,372 90,830 6.4% 825 Prepress technicians <strong>and</strong> workers 170,789 80,145 -53.1% 826 Printing machine operators 283,907 207,720 -26.8% Textile, apparel, <strong>and</strong> furnishings workers: 1,808,168 1,143,682 -36.7% 830 Laundry <strong>and</strong> dry-cleaning workers 224,583 223,824 -0.3% 831 Pressers, textile, garment, <strong>and</strong> related materials 153,646 92,456 -39.8% 832 Sewing machine operators 783,799 471,113 -39.9% 833 Shoe <strong>and</strong> leather workers <strong>and</strong> repairers 42,088 17,881 -57.5% 834 Shoe machine operators <strong>and</strong> tenders 36,029 10,066 -72.1% 835 Tailors, dressmakers, <strong>and</strong> sewers 156,022 109,248 -30.0% 836 Textile bleaching <strong>and</strong> dyeing machine operators <strong>and</strong> tenders 16,146 9,600 -40.5% 840 Textile cutting machine setters, operators, <strong>and</strong> tenders 45,576 17,815 -60.9% 841 Textile knitting <strong>and</strong> weaving machine setters, operators, <strong>and</strong> tenders 65,485 36,988 -43.5% 842 Textile winding, twisting, <strong>and</strong> drawing out machine setters, operators, <strong>and</strong> tenders 70,786 40,998 -42.1% 845 Upholsterers 79,372 60,059 -24.3% (846) Miscellaneous textile, apparel, <strong>and</strong> furnishings workers: 134,634 53,634 -60.2% 843 Extruding <strong>and</strong> forming machine setters, operators, <strong>and</strong> tenders, synthetic <strong>and</strong> glass fibe 2,887 1,343 -53.5% 844 Fabric <strong>and</strong> apparel patternmakers 10,757 5,809 -46.0% 846 Textile, apparel, <strong>and</strong> furnishings workers, all other 120,990 46,482 -61.6% Woodworkers: 291,805 277,775 -4.8% 850 Cabinetmakers <strong>and</strong> bench carpenters 77,648 88,634 14.1% 851 Furniture finishers 35,403 29,615 -16.3% 853 Sawing machine setters, operators, <strong>and</strong> tenders, wood 91,694 68,189 -25.6% 854 Woodworking machine setters, operators, <strong>and</strong> tenders, except sawing 48,616 49,268 1.3% (855) Miscellaneous woodworkers: 38,443 42,069 9.4% 13
- Page 1 and 2:
The Relationship Between The 1990 C
- Page 3 and 4:
TABLE OF CONTENTS Technical Report:
- Page 5 and 6:
The Relationship Between the 1990 C
- Page 7 and 8:
After 1990, however, the crosswalks
- Page 9 and 10:
entertainment, and recreation,”
- Page 11 and 12:
apply those factors to census data
- Page 13 and 14:
“majority” choice in most cases
- Page 15 and 16:
went to category 340, “Emergency
- Page 17 and 18:
Industry 1. Small, new, and residua
- Page 19 and 20:
The data presented in this report a
- Page 22 and 23:
1990 CENSUS CODE APPENDIX A. 1990 C
- Page 24 and 25:
CENSUS CODE MANUFACTURING - Continu
- Page 26 and 27:
CENSUS CODE RETAIL TRADE 580 Lumber
- Page 28:
CENSUS CODE PROFESSIONAL AND RELATE
- Page 31 and 32:
045 Metallurgical and materials (16
- Page 33 and 34:
Writers, Artists, Entertainers, and
- Page 35 and 36:
327 Order clerks (4664) 328 Personn
- Page 37 and 38:
457 Barbers (5252) 458 Hairdressers
- Page 39 and 40:
594 Paving, surfacing, and tamping
- Page 41 and 42:
749 Miscellaneous textile machine o
- Page 44 and 45:
APPENDIX C. CENSUS 2000 INDUSTRY CL
- Page 46 and 47:
Census 2000 1997 NAICS Code Categor
- Page 48 and 49:
Census 2000 1997 NAICS Code Categor
- Page 50:
Census 2000 1997 NAICS Code Categor
- Page 53 and 54:
Census 2000 2000 SOC Code Category
- Page 55 and 56:
Census 2000 2000 SOC Code Category
- Page 57 and 58:
Census 2000 2000 SOC Code Category
- Page 59 and 60:
Census 2000 2000 SOC Code Category
- Page 61 and 62:
Census 2000 2000 SOC Code Category
- Page 64 and 65:
APPENDIX E. BIBLIOGRAPHY OF RELATED
- Page 66 and 67:
APPENDIX G. GLOSSARY OF TERMS AND A
- Page 68 and 69:
Industry and Occupation The 1990 ce
- Page 70 and 71:
1990 Census Codes and Categories Ce
- Page 72 and 73:
1990 Census Codes and Categories Ce
- Page 74 and 75:
1990 Census Codes and Categories Ce
- Page 76 and 77:
1990 Census Codes and Categories Ce
- Page 78 and 79:
1990 Census Codes and Categories Ce
- Page 80 and 81:
1990 Census Codes and Categories Ta
- Page 82 and 83:
1990 Census Codes and Categories Ce
- Page 84 and 85:
1990 Census Codes and Categories Ce
- Page 86 and 87:
1990 Census Codes and Categories Ce
- Page 88 and 89:
1990 Census Codes and Categories Ce
- Page 90 and 91:
1990 Census Codes and Categories Ce
- Page 92 and 93:
Table 2. 1990 Census Occupation Cla
- Page 94 and 95:
1990 Census Codes and Categories Ce
- Page 96 and 97:
1990 Census Codes and Categories Ce
- Page 98 and 99:
1990 Census Codes and Categories Ce
- Page 100 and 101:
1990 Census Codes and Categories Ce
- Page 102 and 103:
1990 Census Codes and Categories Ce
- Page 104 and 105:
1990 Census Codes and Categories Ce
- Page 106 and 107:
1990 Census Codes and Categories Ta
- Page 108 and 109:
1990 Census Codes and Categories Ce
- Page 110 and 111:
1990 Census Codes and Categories Ta
- Page 112 and 113:
1990 Census Codes and Categories Ce
- Page 114 and 115:
1990 Census Codes and Categories Ce
- Page 116 and 117:
1990 Census Codes and Categories Ce
- Page 118 and 119:
1990 Census Codes and Categories Ce
- Page 120 and 121:
1990 Census Codes and Categories Ce
- Page 122 and 123:
1990 Census Codes and Categories Ce
- Page 124 and 125:
1990 Census Codes and Categories Ta
- Page 126 and 127:
1990 Census Codes and Categories Ce
- Page 128 and 129:
1990 Census Codes and Categories Ce
- Page 130 and 131:
1990 Census Codes and Categories Ce
- Page 132 and 133:
1990 Census Codes and Categories Ce
- Page 134 and 135:
1990 Census Codes and Categories Ce
- Page 136 and 137:
1990 Census Codes and Categories Ce
- Page 138 and 139:
1990 Census Codes and Categories Ce
- Page 140 and 141:
1990 Census Codes and Categories Ce
- Page 142 and 143:
1990 Census Codes and Categories Ce
- Page 144 and 145:
Table 7. 1990 Census STF-3 Occupati
- Page 146 and 147:
Table 7. 1990 Census STF-3 Occupati
- Page 148 and 149:
Table 7. 1990 Census STF-3 Occupati
- Page 150 and 151:
Table 6. 1990 Census STF-3 Industry
- Page 152 and 153:
Table 6. 1990 Census STF-3 Industry
- Page 154 and 155:
Table 5. 1990 STF-4 Occupation Grou
- Page 156 and 157:
Table 5. 1990 STF-4 Occupation Grou
- Page 158 and 159:
Table 5. 1990 STF-4 Occupation Grou
- Page 160 and 161:
Table 5. 1990 STF-4 Occupation Grou
- Page 162 and 163:
Table 5. 1990 STF-4 Occupation Grou
- Page 164 and 165:
Table 5. 1990 STF-4 Occupation Grou
- Page 166 and 167:
Table 5. 1990 STF-4 Occupation Grou
- Page 168 and 169:
Table 4. 1990 STF-4 Industry Groups
- Page 170 and 171:
Table 4. 1990 STF-4 Industry Groups
- Page 172 and 173:
Table 4. 1990 STF-4 Industry Groups
- Page 174 and 175:
Table 4. 1990 STF-4 Industry Groups
- Page 176 and 177:
Table 4. 1990 STF-4 Industry Groups
- Page 178 and 179:
Table 3. 1990 Census EEO File Occup
- Page 180 and 181:
1990 Census Codes and Categories Ta
- Page 182 and 183:
1990 Census Codes and Categories Ta
- Page 184 and 185:
1990 Census Codes and Categories Ta
- Page 186 and 187:
1990 Census Codes and Categories Ta
- Page 188 and 189:
1990 Census Codes and Categories Ta
- Page 190 and 191:
1990 Census Codes and Categories Ta
- Page 192 and 193:
1990 Census Codes and Categories Ta
- Page 194 and 195:
1990 Census Codes and Categories Ta
- Page 196 and 197:
1990 Census Codes and Categories Ta
- Page 198 and 199: 1990 Census Codes and Categories Ta
- Page 200 and 201: 1990 Census Codes and Categories Ta
- Page 202 and 203: 1990 Census Codes and Categories Ta
- Page 204 and 205: 1990 Census Codes and Categories Ce
- Page 206 and 207: 1990 Census Codes and Categories Ta
- Page 208 and 209: 1990 Census Codes and Categories Ta
- Page 210 and 211: 1990 Census Codes and Categories Ta
- Page 212 and 213: 1990 Census Codes and Categories Ta
- Page 214 and 215: 1990 Census Codes and Categories Ta
- Page 216 and 217: 1990 Census Codes and Categories Ta
- Page 218 and 219: 1990 Census Codes and Categories Ce
- Page 220 and 221: 1990 Census Codes and Categories Ta
- Page 222 and 223: 1990 Census Codes and Categories Ta
- Page 224 and 225: 1990 Census Codes and Categories Ta
- Page 226 and 227: 1990 Census Codes and Categories Ta
- Page 228 and 229: 1990 Census Codes and Categories Ta
- Page 230 and 231: Table 8. 1990 Census Redistributed
- Page 232 and 233: Table 8. 1990 Census Redistributed
- Page 234 and 235: Table 8. 1990 Census Redistributed
- Page 236 and 237: Table 8. 1990 Census Redistributed
- Page 238 and 239: Table 9. 1990 Census Redistributed
- Page 240 and 241: Table 9. 1990 Census Redistributed
- Page 242 and 243: Table 9. 1990 Census Redistributed
- Page 244 and 245: Table 9. 1990 Census Redistributed
- Page 246 and 247: Table 9. 1990 Census Redistributed
- Page 250 and 251: Table 9. 1990 Census Redistributed
- Page 252 and 253: Table 10. 1990 Census Redistributed
- Page 254 and 255: Table 10. 1990 Census Redistributed
- Page 256 and 257: Table 11. 1990 Census Redistributed
- Page 258 and 259: Table 11. 1990 Census Redistributed
- Page 260 and 261: Template for Converting 1990 Census
- Page 262 and 263: Template for Converting 1990 Census
- Page 264 and 265: Template for Converting 1990 Census
- Page 266 and 267: Template for Converting 1990 Census