

The Relationship Between The 1990 Census and ... - Census Bureau
The Relationship Between The 1990 Census and ... - Census Bureau
The Relationship Between The 1990 Census and ... - Census Bureau

Create successful ePaper yourself
Turn your PDF publications into a flip-book with our unique Google optimized e-Paper software.
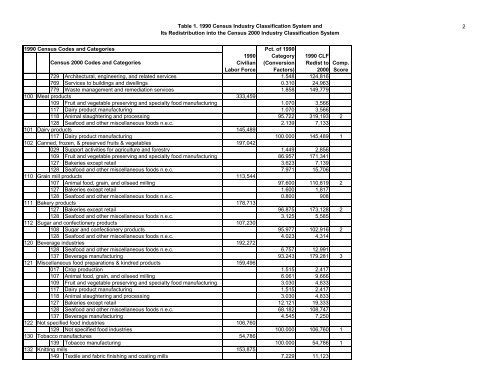
<strong>1990</strong> <strong>Census</strong> Codes <strong>and</strong> Categories<br />
<strong>Census</strong> 2000 Codes <strong>and</strong> Categories<br />
Table 1. <strong>1990</strong> <strong>Census</strong> Industry Classification System <strong>and</strong><br />
Its Redistribution into the <strong>Census</strong> 2000 Industry Classification System<br />
<strong>1990</strong><br />
Civilian<br />
Labor Force<br />
Pct. of <strong>1990</strong><br />
Category<br />
(Conversion<br />
Factors)<br />
<strong>1990</strong> CLF<br />
Redist to<br />
2000<br />
729 Architectural, engineering, <strong>and</strong> related services 1.548 124,816<br />
769 Services to buildings <strong>and</strong> dwellings 0.310 24,963<br />
779 Waste management <strong>and</strong> remediation services 1.858 149,779<br />
100 Meat products 333,459<br />
109 Fruit <strong>and</strong> vegetable preserving <strong>and</strong> specialty food manufacturing 1.070 3,566<br />
117 Dairy product manufacturing 1.070 3,566<br />
118 Animal slaughtering <strong>and</strong> processing 95.722 319,193 2<br />
128 Seafood <strong>and</strong> other miscellaneous foods n.e.c. 2.139 7,133<br />
101 Dairy products 145,489<br />
117 Dairy product manufacturing 100.000 145,489 1<br />
102 Canned, frozen, & preserved fruits & vegetables 197,042<br />
029 Support activities for agriculture <strong>and</strong> forestry 1.449 2,856<br />
109 Fruit <strong>and</strong> vegetable preserving <strong>and</strong> specialty food manufacturing 86.957 171,341<br />
127 Bakeries except retail 3.623 7,139<br />
128 Seafood <strong>and</strong> other miscellaneous foods n.e.c. 7.971 15,706<br />
110 Grain mill products 113,544<br />
107 Animal food, grain, <strong>and</strong> oilseed milling 97.600 110,819 2<br />
127 Bakeries except retail 1.600 1,817<br />
128 Seafood <strong>and</strong> other miscellaneous foods n.e.c. 0.800 908<br />
111 Bakery products 178,713<br />
127 Bakeries except retail 96.875 173,128 2<br />
128 Seafood <strong>and</strong> other miscellaneous foods n.e.c. 3.125 5,585<br />
112 Sugar <strong>and</strong> confectionery products 107,230<br />
108 Sugar <strong>and</strong> confectionery products 95.977 102,916 2<br />
128 Seafood <strong>and</strong> other miscellaneous foods n.e.c. 4.023 4,314<br />
120 Beverage industries 192,272<br />
128 Seafood <strong>and</strong> other miscellaneous foods n.e.c. 6.757 12,991<br />
137 Beverage manufacturing 93.243 179,281 3<br />
121 Miscellaneous food preparations & kindred products 159,496<br />
017 Crop production 1.515 2,417<br />
107 Animal food, grain, <strong>and</strong> oilseed milling 6.061 9,666<br />
109 Fruit <strong>and</strong> vegetable preserving <strong>and</strong> specialty food manufacturing 3.030 4,833<br />
117 Dairy product manufacturing 1.515 2,417<br />
118 Animal slaughtering <strong>and</strong> processing 3.030 4,833<br />
127 Bakeries except retail 12.121 19,333<br />
128 Seafood <strong>and</strong> other miscellaneous foods n.e.c. 68.182 108,747<br />
137 Beverage manufacturing 4.545 7,250<br />
122 Not specified food industries 106,760<br />
129 Not specified food industries 100.000 106,760 1<br />
130 Tobacco manufactures 54,786<br />
139 Tobacco manufacturing 100.000 54,786 1<br />
132 Knitting mills 153,875<br />
149 Textile <strong>and</strong> fabric finishing <strong>and</strong> coating mills 7.229 11,123<br />
Comp.<br />
Score<br />
2


