CBD Fourth National Report - Azerbaijan (English version)
CBD Fourth National Report - Azerbaijan (English version)
CBD Fourth National Report - Azerbaijan (English version)

Create successful ePaper yourself
Turn your PDF publications into a flip-book with our unique Google optimized e-Paper software.
Country Study on Biodiversity and <strong>Fourth</strong> <strong>National</strong> <strong>Report</strong><br />
The Republic of <strong>Azerbaijan</strong><br />
Dynamic growth of oil sector will pave a strong way for more acceleration of non-oil sectors<br />
development. Moreover, favourable investment atmosphere created in non-oil sector, ongoing<br />
privatization process and other reforms will provide more intensive development of non-oil<br />
sector within 2008-2012.<br />
Industrial output to the extent of 28 billion Manat was produced in 2008 and increased as 6%<br />
in comparison with 2007. There produced 44.5 million tons of oil and 16.3 billion m 3 of gas<br />
within 2008 that it is higher as 4.6% and 50.4% as compared to 2007.<br />
Untreated discharged effluents diverted to water facilities totalled to 181 million m 3 in 2008.<br />
Volume of pollutant emissions totalled to 923.0 thousand tons and 281 thousand tons out of<br />
them are shared by stationary pollution sources/ fixed sources of environmental pollution.<br />
Volume of sewage diverted to water reservoirs decreased as 1.7 times, volume of pollutant<br />
emissions as 3.1 times in 2008 in comparison with 1990.<br />
Volume of waters incoming from countrywide water-storage basins totalled to 11.735 billion<br />
m 3 in 2008. Volume of waters taken from countrywide water sources decreased as 1.4 times<br />
in 2008 as compared to 1990. Actual consumption of water was 7.886 billion m 3 , 68% hereof<br />
was used in irrigation, 26% in production and 4.4% for household-farming purposes. Despite<br />
strong water demand appeared in the country, 32.8% of intake water is lost while its delivery.<br />
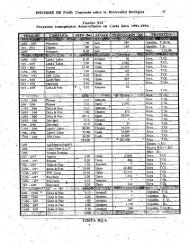
Basic indices characterizing effect of human activity upon the environment are mentioned in<br />
the following table:<br />
Water taken from<br />
water sources, million<br />
m 3<br />
Water consumption,<br />
million m 3<br />
Discharge of water to<br />
surface watercourses,<br />
million m 3<br />
Pollutant emissions,<br />
thousand tons<br />
including:<br />
stationary sources<br />
motor transport<br />
1990 1995 2000 2005 2006 2007 2008<br />
16176<br />
12477<br />
303<br />
2846.1<br />
2108.5<br />
737.6<br />
13976<br />
10223<br />
134<br />
1325.4<br />
878.6<br />
446.8<br />
90<br />
11110<br />
6588<br />
171<br />
908.1<br />
515.4<br />
392.7<br />
12050<br />
8607<br />
161<br />
1054<br />
558<br />
12360<br />
8865<br />
163<br />
875<br />
344<br />
12270<br />
8371<br />
177<br />
970<br />
386<br />
11735<br />
Share of pollutant emissions from fixed sources of environmental pollution per m 2 area unit of<br />
the republic totals to 3.2 tons, share of of pollutant emissions per capita totals to 33 kg.<br />
496<br />
531<br />
7886<br />
It should be noted that one of factors considerably effecting to aggravation of countrywide<br />
ecological situation is characterized in previously accumulated and presently generated<br />
hazardous wastes. At the present, there remained approximate 2.5 million tons of hazardous<br />
wastes in landfills, enterprises and refuse dumps.<br />
Alongside with that declining in scale of construction and reconstruction of nature<br />
conservancy facilities due to insufficient investment to basic capital adversely impacted upon<br />
584<br />
181<br />
923<br />
281<br />
642<br />
2009