

US Economic Briefing: High Frequency Indicators
US Economic Briefing: High Frequency Indicators
US Economic Briefing: High Frequency Indicators

Create successful ePaper yourself
Turn your PDF publications into a flip-book with our unique Google optimized e-Paper software.
22<br />
21<br />
20<br />
19<br />
18<br />
17<br />
16<br />
3.2<br />
3.0<br />
2.8<br />
2.6<br />
2.4<br />
2.2<br />
2.0<br />
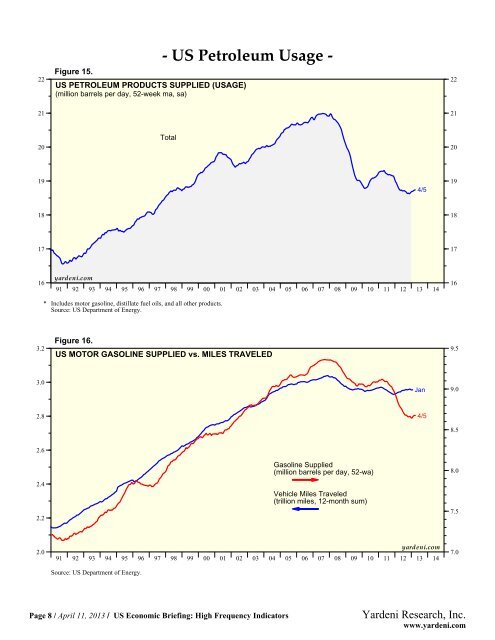
Figure 15.<br />
<strong>US</strong> PETROLEUM PRODUCTS SUPPLIED (<strong>US</strong>AGE)<br />
(million barrels per day, 52-week ma, sa)<br />
yardeni.com<br />
Total<br />
91 92 93 94 95 96 97 98 99 00 01 02 03 04 05 06 07 08 09 10 11 12 13 14<br />
* Includes motor gasoline, distillate fuel oils, and all other products.<br />
Source: <strong>US</strong> Department of Energy.<br />
Figure 16.<br />
<strong>US</strong> MOTOR GASOLINE SUPPLIED vs. MILES TRAVELED<br />
91 92 93 94 95 96 97 98 99 00 01 02 03 04 05 06 07 08 09 10 11 12 13 14<br />
Source: <strong>US</strong> Department of Energy.<br />
- <strong>US</strong> Petroleum Usage -<br />
Page 8 / April 11, 2013 / <strong>US</strong> <strong>Economic</strong> <strong>Briefing</strong>: <strong>High</strong> <strong>Frequency</strong> <strong>Indicators</strong><br />
Gasoline Supplied<br />
(million barrels per day, 52-wa)<br />
Vehicle Miles Traveled<br />
(trillion miles, 12-month sum)<br />
4/5<br />
Jan<br />
4/5<br />
yardeni.com<br />
22<br />
21<br />
20<br />
19<br />
18<br />
17<br />
16<br />
9.5<br />
9.0<br />
8.5<br />
8.0<br />
7.5<br />
7.0<br />
Yardeni Research, Inc.<br />
www.yardeni.com