

US Economic Briefing: High Frequency Indicators
US Economic Briefing: High Frequency Indicators
US Economic Briefing: High Frequency Indicators

You also want an ePaper? Increase the reach of your titles
YUMPU automatically turns print PDFs into web optimized ePapers that Google loves.
150<br />
130<br />
110<br />
90<br />
70<br />
50<br />
30<br />
150<br />
140<br />
130<br />
120<br />
110<br />
100<br />
90<br />
80<br />
70<br />
60<br />
50<br />
40<br />
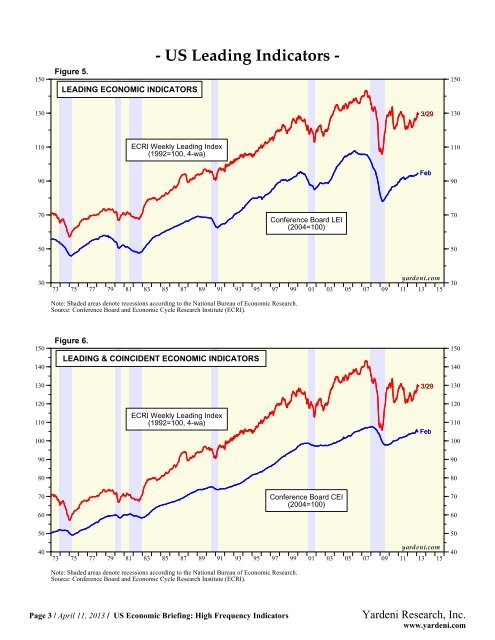
Figure 5.<br />
LEADING ECONOMIC INDICATORS<br />
ECRI Weekly Leading Index<br />
(1992=100, 4-wa)<br />
Conference Board LEI<br />
(2004=100)<br />
73 75 77 79 81 83 85 87 89 91 93 95 97 99 01 03 05 07 09 11 13 15<br />
Note: Shaded areas denote recessions according to the National Bureau of <strong>Economic</strong> Research.<br />
Source: Conference Board and <strong>Economic</strong> Cycle Research Institute (ECRI).<br />
Figure 6.<br />
- <strong>US</strong> Leading <strong>Indicators</strong> -<br />
LEADING & COINCIDENT ECONOMIC INDICATORS<br />
ECRI Weekly Leading Index<br />
(1992=100, 4-wa)<br />
3/29<br />
Feb<br />
yardeni.com<br />
73 75 77 79 81 83 85 87 89 91 93 95 97 99 01 03 05 07 09 11 13 15<br />
Note: Shaded areas denote recessions according to the National Bureau of <strong>Economic</strong> Research.<br />
Source: Conference Board and <strong>Economic</strong> Cycle Research Institute (ECRI).<br />
Page 3 / April 11, 2013 / <strong>US</strong> <strong>Economic</strong> <strong>Briefing</strong>: <strong>High</strong> <strong>Frequency</strong> <strong>Indicators</strong><br />
Conference Board CEI<br />
(2004=100)<br />
3/29<br />
Feb<br />
yardeni.com<br />
150<br />
130<br />
110<br />
90<br />
70<br />
50<br />
30<br />
150<br />
140<br />
130<br />
120<br />
110<br />
100<br />
90<br />
80<br />
70<br />
60<br />
50<br />
40<br />
Yardeni Research, Inc.<br />
www.yardeni.com