

US Economic Briefing: High Frequency Indicators
US Economic Briefing: High Frequency Indicators
US Economic Briefing: High Frequency Indicators

You also want an ePaper? Increase the reach of your titles
YUMPU automatically turns print PDFs into web optimized ePapers that Google loves.
230<br />
210<br />
190<br />
170<br />
150<br />
130<br />
110<br />
90<br />
80<br />
70<br />
60<br />
50<br />
40<br />
30<br />
20<br />
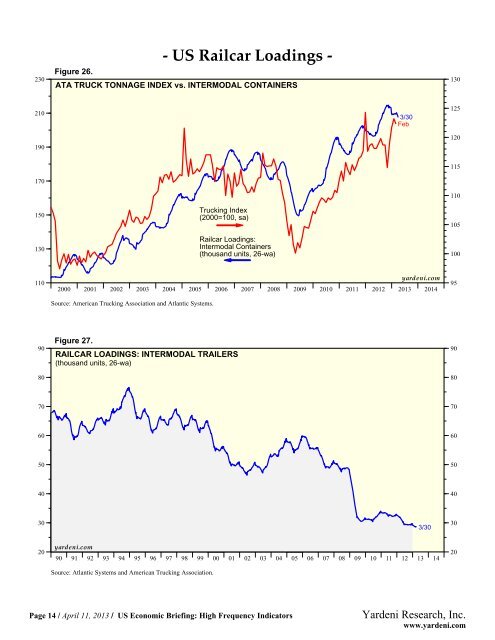
Figure 26.<br />
ATA TRUCK TONNAGE INDEX vs. INTERMODAL CONTAINERS<br />
Trucking Index<br />
(2000=100, sa)<br />
Railcar Loadings:<br />
Intermodal Containers<br />
(thousand units, 26-wa)<br />
2000 2001 2002 2003 2004 2005 2006 2007 2008 2009 2010 2011 2012 2013 2014<br />
Source: American Trucking Association and Atlantic Systems.<br />
Figure 27.<br />
RAILCAR LOADINGS: INTERMODAL TRAILERS<br />
(thousand units, 26-wa)<br />
yardeni.com<br />
3/30<br />
Feb<br />
yardeni.com<br />
90 91 92 93 94 95 96 97 98 99 00 01 02 03 04 05 06 07 08 09 10 11 12 13 14<br />
Source: Atlantic Systems and American Trucking Association.<br />
- <strong>US</strong> Railcar Loadings -<br />
Page 14 / April 11, 2013 / <strong>US</strong> <strong>Economic</strong> <strong>Briefing</strong>: <strong>High</strong> <strong>Frequency</strong> <strong>Indicators</strong><br />
3/30<br />
130<br />
125<br />
120<br />
115<br />
110<br />
105<br />
100<br />
95<br />
90<br />
80<br />
70<br />
60<br />
50<br />
40<br />
30<br />
20<br />
Yardeni Research, Inc.<br />
www.yardeni.com