

US Economic Briefing: High Frequency Indicators
US Economic Briefing: High Frequency Indicators
US Economic Briefing: High Frequency Indicators

Create successful ePaper yourself
Turn your PDF publications into a flip-book with our unique Google optimized e-Paper software.
2200<br />
2100<br />
2000<br />
1900<br />
1800<br />
1700<br />
1600<br />
1500<br />
1400<br />
1300<br />
450<br />
400<br />
350<br />
300<br />
250<br />
200<br />
150<br />
100<br />
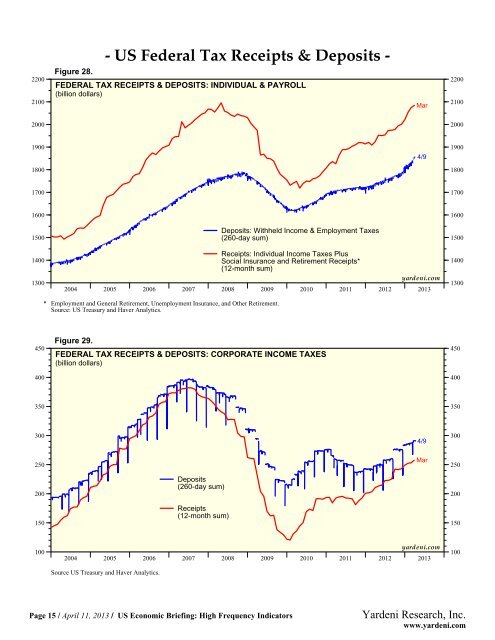
Figure 28.<br />
FEDERAL TAX RECEIPTS & DEPOSITS: INDIVIDUAL & PAYROLL<br />
(billion dollars)<br />
2004 2005 2006 2007 2008 2009 2010 2011 2012 2013<br />
* Employment and General Retirement, Unemployment Insurance, and Other Retirement.<br />
Source: <strong>US</strong> Treasury and Haver Analytics.<br />
Figure 29.<br />
- <strong>US</strong> Federal Tax Receipts & Deposits -<br />
Deposits: Withheld Income & Employment Taxes<br />
(260-day sum)<br />
Receipts: Individual Income Taxes Plus<br />
Social Insurance and Retirement Receipts*<br />
(12-month sum)<br />
FEDERAL TAX RECEIPTS & DEPOSITS: CORPORATE INCOME TAXES<br />
(billion dollars)<br />
Mar<br />
4/9<br />
yardeni.com<br />
2004 2005 2006 2007 2008 2009 2010 2011 2012 2013<br />
Source <strong>US</strong> Treasury and Haver Analytics.<br />
Deposits<br />
(260-day sum)<br />
Receipts<br />
(12-month sum)<br />
Page 15 / April 11, 2013 / <strong>US</strong> <strong>Economic</strong> <strong>Briefing</strong>: <strong>High</strong> <strong>Frequency</strong> <strong>Indicators</strong><br />
4/9<br />
Mar<br />
yardeni.com<br />
2200<br />
2100<br />
2000<br />
1900<br />
1800<br />
1700<br />
1600<br />
1500<br />
1400<br />
1300<br />
450<br />
400<br />
350<br />
300<br />
250<br />
200<br />
150<br />
100<br />
Yardeni Research, Inc.<br />
www.yardeni.com