

US Economic Briefing: High Frequency Indicators
US Economic Briefing: High Frequency Indicators
US Economic Briefing: High Frequency Indicators

Create successful ePaper yourself
Turn your PDF publications into a flip-book with our unique Google optimized e-Paper software.
4.2<br />
4.0<br />
3.8<br />
3.6<br />
3.4<br />
3.2<br />
3.0<br />
2.8<br />
2.6<br />
2.4<br />
2.2<br />
2.0<br />
1.8<br />
1.6<br />
1.4<br />
1.2<br />
1.0<br />
.8<br />
.6<br />
2400<br />
2200<br />
2000<br />
1800<br />
1600<br />
1400<br />
1200<br />
1000<br />
800<br />
600<br />
400<br />
200<br />
0<br />
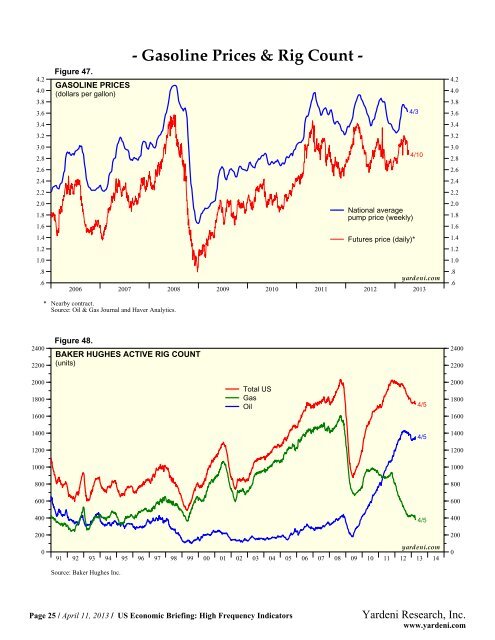
Figure 47.<br />
GASOLINE PRICES<br />
(dollars per gallon)<br />
2006 2007 2008 2009 2010 2011 2012 2013<br />
* Nearby contract.<br />
Source: Oil & Gas Journal and Haver Analytics.<br />
Figure 48.<br />
BAKER HUGHES ACTIVE RIG COUNT<br />
(units)<br />
4/3<br />
National average<br />
pump price (weekly)<br />
Futures price (daily)*<br />
4/10<br />
yardeni.com<br />
91 92 93 94 95 96 97 98 99 00 01 02 03 04 05 06 07 08 09 10 11 12 13 14<br />
Source: Baker Hughes Inc.<br />
- Gasoline Prices & Rig Count -<br />
Total <strong>US</strong><br />
Gas<br />
Oil<br />
Page 25 / April 11, 2013 / <strong>US</strong> <strong>Economic</strong> <strong>Briefing</strong>: <strong>High</strong> <strong>Frequency</strong> <strong>Indicators</strong><br />
4/5<br />
4/5<br />
4/5<br />
yardeni.com<br />
4.2<br />
4.0<br />
3.8<br />
3.6<br />
3.4<br />
3.2<br />
3.0<br />
2.8<br />
2.6<br />
2.4<br />
2.2<br />
2.0<br />
1.8<br />
1.6<br />
1.4<br />
1.2<br />
1.0<br />
.8<br />
.6<br />
2400<br />
2200<br />
2000<br />
1800<br />
1600<br />
1400<br />
1200<br />
1000<br />
800<br />
600<br />
400<br />
200<br />
Yardeni Research, Inc.<br />
www.yardeni.com<br />
0