1 A Recursive Dynamic Computable General Equilibrium Model For ...
1 A Recursive Dynamic Computable General Equilibrium Model For ...
1 A Recursive Dynamic Computable General Equilibrium Model For ...

You also want an ePaper? Increase the reach of your titles
YUMPU automatically turns print PDFs into web optimized ePapers that Google loves.
Gt<br />
0.45<br />
0.4<br />
0.35<br />
0.3<br />
0.25<br />
0.2<br />
0.15<br />
0.1<br />
0.05<br />
0.2 0.4 0.6 0.8 1 1.2 1.4 1.6 1.8 2 2.2 2.4 2.6 2.8<br />
Mt<br />
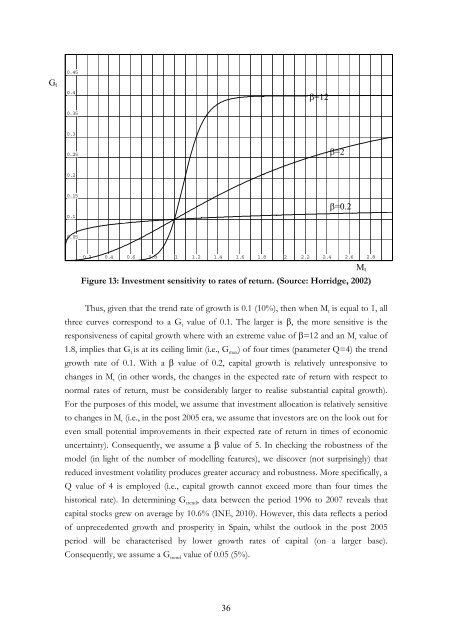
Figure 13: Investment sensitivity to rates of return. (Source: Horridge, 2002)<br />
Thus, given that the trend rate of growth is 0.1 (10%), then when Mt is equal to 1, all<br />
three curves correspond to a Gt value of 0.1. The larger is β, the more sensitive is the<br />
responsiveness of capital growth where with an extreme value of β=12 and an Mt value of<br />
1.8, implies that Gt is at its ceiling limit (i.e., Gmax) of four times (parameter Q=4) the trend<br />
growth rate of 0.1. With a β value of 0.2, capital growth is relatively unresponsive to<br />
changes in Mt (in other words, the changes in the expected rate of return with respect to<br />
normal rates of return, must be considerably larger to realise substantial capital growth).<br />
<strong>For</strong> the purposes of this model, we assume that investment allocation is relatively sensitive<br />
to changes in Mt (i.e., in the post 2005 era, we assume that investors are on the look out for<br />
even small potential improvements in their expected rate of return in times of economic<br />
uncertainty). Consequently, we assume a β value of 5. In checking the robustness of the<br />
model (in light of the number of modelling features), we discover (not surprisingly) that<br />
reduced investment volatility produces greater accuracy and robustness. More specifically, a<br />
Q value of 4 is employed (i.e., capital growth cannot exceed more than four times the<br />
historical rate). In determining Gtrend, data between the period 1996 to 2007 reveals that<br />
capital stocks grew on average by 10.6% (INE, 2010). However, this data reflects a period<br />
of unprecedented growth and prosperity in Spain, whilst the outlook in the post 2005<br />
period will be characterised by lower growth rates of capital (on a larger base).<br />
Consequently, we assume a Gtrend value of 0.05 (5%).<br />
36<br />
β=12<br />
β=2<br />
β=0.2