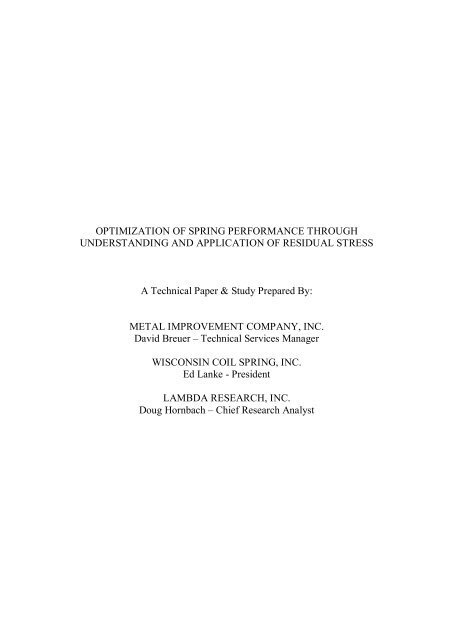
Optimization of Spring Performance Through Understanding and ...
Optimization of Spring Performance Through Understanding and ...
Optimization of Spring Performance Through Understanding and ...

Create successful ePaper yourself
Turn your PDF publications into a flip-book with our unique Google optimized e-Paper software.
OPTIMIZATION OF SPRING PERFORMANCE THROUGH<br />
UNDERSTANDING AND APPLICATION OF RESIDUAL STRESS<br />
A Technical Paper & Study Prepared By:<br />
METAL IMPROVEMENT COMPANY, INC.<br />
David Breuer – Technical Services Manager<br />
WISCONSIN COIL SPRING, INC.<br />
Ed Lanke - President<br />
LAMBDA RESEARCH, INC.<br />
Doug Hornbach – Chief Research Analyst
OPTIMIZATION OF SPRING PERFORMANCE THROUGH<br />
UNDERSTANDING AND APPLICATION OF RESIDUAL STRESS<br />
I. INTRODUCTION<br />
The intent <strong>of</strong> this paper is not to present a new technology available to spring makers <strong>and</strong><br />
spring users. The intent <strong>of</strong> this paper is to utilize existing spring manufacturing <strong>and</strong><br />
analysis techniques to further the underst<strong>and</strong>ing <strong>of</strong> how a spring’s fatigue performance<br />
can be enhanced <strong>and</strong>/or changed by modifying residual stress levels.<br />
The three technologies used in this paper are not new technologies. <strong>Spring</strong> coiling, shot<br />
peening, <strong>and</strong> x-ray diffraction have all been around for decades. When the three are used<br />
interactively, along with scanning electron microscopy (SEM) <strong>and</strong> fatigue testing, the end<br />
result is a closed loop <strong>of</strong> theory supported by actual physical evidence. This is shown in<br />
the form <strong>of</strong> residual stress graph pr<strong>of</strong>iles <strong>and</strong> actual fatigue data proving or disproving<br />
proposed theory.<br />
Critical to this study is the underst<strong>and</strong>ing <strong>and</strong> modifying <strong>of</strong> residual stresses to determine<br />
fatigue performance <strong>of</strong> coiled springs. It was also hoped that new information would be<br />
unveiled through extensive use <strong>of</strong> x-ray diffraction throughout the manufacturing <strong>of</strong> the<br />
springs. The following spring manufacturing techniques are examined <strong>and</strong> explained with<br />
the tools explained in the previous paragraph.<br />
· St<strong>and</strong>ard/Control <strong>Spring</strong>s<br />
· (Single) Shot Peened <strong>Spring</strong>s<br />
· Double Shot Peened <strong>Spring</strong>s<br />
· Dual Shot Peened <strong>Spring</strong>s<br />
· Superfinished (without shot peening) <strong>Spring</strong>s<br />
· Shot Peened & Superfinished <strong>Spring</strong>s<br />
· Strain Peened <strong>Spring</strong>s<br />
II. EXPLANATION OF TOOLS<br />
<strong>Spring</strong> Coiling<br />
The spring industry is representative <strong>of</strong> many manufacturing environments today. There<br />
are increasing dem<strong>and</strong>s on part engineering, performance, tolerances <strong>and</strong> quality.<br />
Frequently the spring is one <strong>of</strong> the last parts designed in an assembly. This means there<br />
is <strong>of</strong>ten limited geometry <strong>and</strong> high expectations <strong>of</strong> part life.<br />
For spring makers to meet these dem<strong>and</strong>s they have to rely on tried <strong>and</strong> true practices<br />
along with incorporating secondary processes <strong>and</strong> analysis techniques. Shot peening, xray<br />
diffraction, <strong>and</strong> superfinishing will be covered in detail throughout this paper. <strong>Spring</strong><br />
makers must know when to used these secondary processes <strong>and</strong> how it will affect their<br />
end product.<br />
One <strong>of</strong> the basics <strong>of</strong> coiling is to incorporate baking operations throughout the<br />
manufacturing process. This is because most any process induces various levels <strong>of</strong><br />
- 1 -
esidual stress into a spring. This area is examined thoroughly in this paper through the<br />
use <strong>of</strong> x-ray diffraction.<br />
A baking operation will partially neutralize the highest stresses <strong>of</strong> any operation which<br />
will reduce chances <strong>of</strong> material cracking (especially for Chrome-Silicon wire) <strong>and</strong><br />
minimize changes in load either immediately or after a period <strong>of</strong> time known as “taking a<br />
set”. This study <strong>of</strong> Chrome-Silicon spring wire utilizes two baking temperatures; 550<br />
degrees Fahrenheit immediately following coiling <strong>and</strong> 400 – 450 F following shot<br />
peening operations. Temperatures above 450 F will begin to relieve out beneficial<br />
compressive stresses from shot peening.<br />
One notes that the shot peening operation, though extremely beneficial for increasing<br />
fatigue properties, makes holding spring tolerances more difficult. Typically, one can<br />
expect an approximate 1 – 3% decrease in spring load following shot peening. In<br />
addition, the load variation is greater following the shot peening operation. These factors<br />
must be taken into consideration when meeting customers’ dem<strong>and</strong>s <strong>of</strong> increased fatigue<br />
life <strong>and</strong> tighter tolerances.<br />
Customers who purchase springs should know that these changes can be expected with<br />
shot peening. Generally springs with load tolerances <strong>of</strong> 5.0% to 7.5% become difficult to<br />
make when shot peening is added. These increased tolerances with shot peening can<br />
result in additional material cost <strong>and</strong> production time which will negatively impact pr<strong>of</strong>it<br />
margins. If possible, the widest spring load tolerances should be utilized when shot<br />
peening is incorporated. A spring maker can then take this into account when designing<br />
<strong>and</strong> making the springs. For example, if a spring maker receives a load tolerance <strong>of</strong> ±<br />
12.5%, he will design his manufacturing process with a ± 10% load tolerance to fall<br />
within the 12.5%<br />
Aside from baking <strong>and</strong> accounting for load changes associated with manufacturing <strong>and</strong><br />
shot peening, the spring maker needs to deliver a product free from rusting. To<br />
accomplish this, carbon steel springs should be lightly oiled following shot peening.<br />
Stainless steel springs should be passivated after the shot peening post bake operation.<br />
Shot Peening<br />
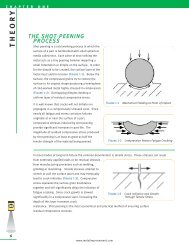
Shot peening is a cold working process used to increase the fatigue properties <strong>of</strong> metal<br />
components. During the peening process, the surface <strong>of</strong> the component is showered with<br />
many thous<strong>and</strong>s <strong>of</strong> small, spherical pieces <strong>of</strong> media called shot. Each piece <strong>of</strong> media acts<br />
as a tiny peening hammer leaving the surface stressed in residual compression. When<br />
controlled properly, all surface area, which is susceptible to fatigue crack initiation, is<br />
encapsulated in a uniform layer <strong>of</strong> compressive stress.<br />
The compressive stress is formed as a result <strong>of</strong> the impact <strong>of</strong> the media with the surface<br />
<strong>of</strong> the spring. During impact, the localized surface area <strong>of</strong> spring is stretched beyond its<br />
yield point in tension. After the media rebounds away, the surface tries to restore itself<br />
- 2 -
y pushing out the impacted area. This cannot take place because mechanical yielding<br />
has occurred which results in a “dimple” surrounded by compressive stress.<br />
The amount <strong>of</strong> residual, compressive stress from shot peening is directly related to the<br />
reduction <strong>of</strong> the applied tensile stress, which can cause fatigue failure. Hence, more<br />
compressive stress results in greater improvements in fatigue properties. This is<br />
especially important since fatigue life is plotted as tensile stress on the vertical axis (on a<br />
linear scale) <strong>and</strong> life cycles on the horizontal axis (on an exponential scale). This means<br />
a linear decrease in tensile stress translates to an exponential increase in fatigue life. This<br />
is shown in the following graph common known as an S-N curve. Please note that it is<br />
not representative <strong>of</strong> any material.<br />
(Tensile) Stress - ksi<br />
160<br />
140<br />
120<br />
100<br />
80<br />
60<br />
40<br />
20<br />
0<br />
Typical Stress vs Load Cycles<br />
50,000 cycles @ 100 ksi<br />
10000 100000 1000000 10000000<br />
Number <strong>of</strong> Cycles<br />
What is important to note in the above graph is that at lower tensile stress levels,<br />
particularly the 50 ksi range, the life <strong>of</strong> the spring approaches infinity as 10 million or<br />
more cycles can be expected. The goal <strong>of</strong> shot peening, as stated before, is to induce<br />
compressive stresses to lower or <strong>of</strong>fset the tensile stresses which cause fatigue failure.<br />
<strong>Through</strong>out this paper are many residual stress pr<strong>of</strong>iles (graphs) which were generated by<br />
the use <strong>of</strong> x-ray diffraction. These are plots <strong>of</strong> residual stress (tensile <strong>and</strong>/or<br />
compressive) versus depth from the surface. The three important variables (when shot<br />
peening is applied) are the surface compressive stress, maximum compressive stress, <strong>and</strong><br />
depth <strong>of</strong> compression. This surface compressive stress is the stress at a depth <strong>of</strong> 0.000”<br />
or the very outermost surface layer. The next important variable is the maximum<br />
compressive stress which occurs 0.001” - 0.002” below the surface. The final variable is<br />
the depth <strong>of</strong> the compressive layer which is where the residual compressive stresses<br />
convert to residual tensile stresses. The subsurface tensile stress is a result <strong>of</strong> the<br />
previous forming operation <strong>and</strong> re-static balancing <strong>of</strong> the near surface compressive layer.<br />
- 3 -<br />
200,000 cycles @ 65 ksi
X-Ray Diffraction<br />
X-ray diffraction (XRD) is the most accurate <strong>and</strong> best developed method for quantifying<br />
residual stress due various mechanical/thermal treatments such as bending, coiling, shot<br />
peening, welding, machining, various finishing operations, etc…, <strong>and</strong> <strong>of</strong>fers several<br />
advantages over other methods, such as mechanical, ultrasonic or magnetic techniques.<br />
XRD is a linear elastic method in which the residual stress in a material is calculated<br />
from the strain in the crystal lattice. The theoretical basis <strong>and</strong> explanations are discussed<br />
elsewhere. (1) XRD can be employed to quantify the residual stress as a function <strong>of</strong> depth<br />
to thous<strong>and</strong>ths <strong>of</strong> an inch below the surface, with high resolution due to the shallow<br />
penetration <strong>of</strong> the x-ray beam. XRD techniques are well established, having been<br />
st<strong>and</strong>ardized <strong>and</strong> developed by both the SAE (2) <strong>and</strong> the ASTM. (3,4)<br />
XRD methods have been used for many years in the aerospace, automotive <strong>and</strong> nuclear<br />
industries to quantify residual stresses <strong>and</strong> are employed in quality control applications to<br />
verify <strong>and</strong> confirm specific levels <strong>of</strong> compressive stress on shot peened components. As<br />
engineers rely more on residual stresses to increase the performance <strong>of</strong> components, it is<br />
necessary to underst<strong>and</strong> <strong>and</strong> control residual stress levels.<br />
In order to determine the residual stresses as a function <strong>of</strong> depth for this test study, XRD<br />
residual stress measurements were obtained in the direction parallel to the spring wire<br />
axis at the surface <strong>and</strong> at nominal depths <strong>of</strong> 0.5,1, 2, 3, 4, 5, 6, 7, & 10 x 10 –3 inches<br />
(mils) into the wire. These depths were chosen to best define the residual stress<br />
distribution due to coiling, baking, shot peening, <strong>and</strong> superfinising. The residual stress<br />
measurements were made at mid-length <strong>of</strong> each coil on the inside diameter. The inside<br />
diameter position was chosen because failures typically initiate on this location for<br />
compression springs.<br />
X-ray diffraction residual stress measurements were made by the two-angle sin 2<br />
method<br />
per SAE J784a. (2) Multi-angle measurements were obtained at 10 x 10 -3 inches below the<br />
surface on the St<strong>and</strong>ard/Control springs to verify a linear dependence <strong>of</strong> lattice spacing<br />
vs. sin 2<br />
. The results show a linear response <strong>of</strong> lattice spacing vs. sin 2<br />
, indicating a<br />
condition <strong>of</strong> plane stress at the surface, appropriate for XRD methods. Measurements<br />
were made employing the diffraction <strong>of</strong> chromium K-alpha radiation from the (211)<br />
crystallographic planes <strong>of</strong> the BCC structure <strong>of</strong> the Cr-Si steel. The diffraction peak<br />
angular position at each psi tilt was determined from the position <strong>of</strong> the K-alpha 1<br />
diffraction peak separated from the superimposed K-alpha doublet assuming a Pearson<br />
VII function diffraction peak pr<strong>of</strong>ile in the high back-reflection region. (5) The diffracted<br />
intensity, peak breadth, <strong>and</strong> position <strong>of</strong> the K-alpha 1 diffraction peak were determined<br />
by fitting the Pearson VII function peak pr<strong>of</strong>ile by least squares regression after<br />
correction for the Lorentz polarization <strong>and</strong> absorption effects <strong>and</strong> for a linearly sloping<br />
background intensity.<br />
Prior to the x-ray diffraction measurements, a 90-deg. segment <strong>of</strong> each coil spring was<br />
removed from mid-length <strong>of</strong> the coil in order to provide access for the incident <strong>and</strong><br />
diffracted x-ray beams. A high speed aluminum oxide cutting wheel was used to section<br />
the 90-deg. segment. During sectioning, the spring was subjected to a mist coolant spray<br />
- 4 -
to ensure minimal heat input from the cutting wheel. Stress relaxation at the measurement<br />
location due to sectioning was assumed negligible. The XRD measurement location was<br />
nominally two diameters from the cut end in order to minimize edge effects.<br />
A 0.040” x 0.080” irradiated area (long axis parallel to the spring wire axis) was used on<br />
the sample surface in order to minimize error due to the curvature <strong>of</strong> the spring wire. The<br />
radiation was detected employing a scintillation detector set for 90% acceptance <strong>of</strong> the<br />
chromium K-alpha radiation.<br />
The value <strong>of</strong> the x-ray elastic constant, E/(1 + ), required to calculate the macroscopic<br />
residual stress from the strain measured normal to the (211) planes <strong>of</strong> Cr-Si steel was<br />
previously determined empirically (6) by employing a simple rectangular beam<br />
manufactured from Cr-Si steel loaded in four-point bending on the diffractometer to<br />
known stress levels <strong>and</strong> measuring the resulting change in the spacing <strong>of</strong> the (211) planes<br />
in accordance with ASTM E1426-94. (4)<br />
Material was removed for subsurface measurement by electropolishing a nominal .200 x<br />
0.100” pocket on the inside diameter <strong>of</strong> the coil in a phosphoric-sulfuric acid base<br />
electrolyte solution. The electropolishing minimizes the possible alteration <strong>of</strong> the<br />
residual stress distribution as a result <strong>of</strong> material removal. All macroscopic residual<br />
stress data obtained as a function <strong>of</strong> depth were corrected for the effects <strong>of</strong> penetration <strong>of</strong><br />
the radiation employed for residual stress measurement into the subsurface stress<br />
gradient. (7) Stress relaxation due to layer removal was corrected by employing the<br />
method <strong>of</strong> Moore & Evans, (8) assuming the specimen behaved as a flat plate in the area<br />
which was electropolished. The higher the stress <strong>and</strong> the greater the depth <strong>of</strong> removal,<br />
the larger the relaxation will generally be. Finite element methods could be employed for<br />
a more rigorous layer removal correction if greater depths were investigated.<br />
Systematic error due to instrument alignment was monitored employing a powdered iron<br />
zero stress reference sample. The measured residual stress in the powdered iron sample<br />
was found to be within ±2 ksi <strong>of</strong> zero stress.<br />
The microscopic residual stress was determined during the macrostress measurement by<br />
measuring the full width at half maximum intensity (FWHM) <strong>of</strong> the (211) diffraction<br />
peak in the psi = 10 deg. orientation. The (211) diffraction peak width is a sensitive<br />
function <strong>of</strong> the chemistry, hardness, <strong>and</strong> the degree to which the material has been cold<br />
worked. In martensitic steels, it is commonly observed that plastic deformation produced<br />
by processes, such as shot peening or grinding, will cause work s<strong>of</strong>tening <strong>and</strong> a reduction<br />
in the peak width. In work hardening materials, the diffraction peak width increases<br />
significantly as a result <strong>of</strong> an increase in the average microstrain <strong>and</strong> the reduced<br />
crystallite size produced by cold working. Empirical relationships between cold work or<br />
hardness <strong>and</strong> peak broadening for several nickel base, titanium <strong>and</strong> steel alloys have been<br />
determined. No calibration curves were obtained to define such dependence for the Cr-Si<br />
steel peak breadth investigated in the present analysis.<br />
- 5 -
III. RESULTS OF MANUFACTURING TECHNIQUES<br />
The compression spring selected for this technical study was designed with an expected<br />
cycle life <strong>of</strong> less than 100,000 cycles with a plain finish <strong>and</strong> no shot peening. These are<br />
the St<strong>and</strong>ard/Control springs described in the next section.<br />
From this St<strong>and</strong>ard/Control spring lot, separate lots were created such that the other<br />
evaluated spring manufacturing types (listed in the Introduction) were all from the same<br />
heat lot <strong>of</strong> (Cr-Si) spring wire. In addition, the extension springs used in this study were<br />
from the same heat lot <strong>of</strong> wire.<br />
The spring wire used for this study was a nominal 0.250” diameter oil tempered Chrome-<br />
Silicon. The spring wire had a nominal ultimate tensile strength (UTS) <strong>of</strong> 260 ksi. The<br />
following photograph is the compression spring (free length <strong>of</strong> 5.21”) used for most <strong>of</strong><br />
the study <strong>and</strong> the extension spring used for a portion <strong>of</strong> the study. Additional technical<br />
information on the spring <strong>and</strong>/or wire is at the end <strong>of</strong> the paper.<br />
The main goal <strong>of</strong> the XRD<br />
measurements was to<br />
determine variations in the<br />
residual stress produced by<br />
the different manufacturing<br />
processes such as coiling,<br />
peening <strong>and</strong> thermal<br />
exposure. By obtaining the<br />
residual stress <strong>and</strong> fatigue<br />
life data for the different<br />
manufacturing processes, a<br />
relationship between residual<br />
stress <strong>and</strong> fatigue life for coil<br />
springs can be developed.<br />
Once the relationship <strong>of</strong><br />
residual stress <strong>and</strong> fatigue<br />
life are established for a specific spring, the residual stress state can be optimized to<br />
obtain maximum fatigue life.<br />
St<strong>and</strong>ard/Control <strong>Spring</strong>s<br />
The St<strong>and</strong>ard/Control springs were a lot which was coiled, baked at 550 degrees<br />
Fahrenheit immediately after coiling, <strong>and</strong> then ground. The following photograph is a<br />
S.E.M. photo (courtesy <strong>of</strong> Metallurgical Associates; Waukesha, WI) at 30 times<br />
magnification which shows the ID <strong>of</strong> the compression spring <strong>and</strong> the tooling mark left<br />
from the forming operation. One can see that how tears or scratching (not present in this<br />
photo) in this tool mark could act as initiation sites for premature failure.<br />
- 6 -
Residual Stress (ksi)<br />
200<br />
150<br />
100<br />
50<br />
0<br />
As Coiled - With & Without Post Bake<br />
0.000 0.002 0.004 0.006 0.008 0.010<br />
Depth (inches)<br />
W ithout B ake W ith Bake<br />
- 7 -<br />
The following graph shows<br />
two curves on one graph <strong>of</strong><br />
the as coiled condition<br />
without the required bake <strong>and</strong><br />
the same spring wire with the<br />
post bake. One can see how<br />
the detrimental tensile stress<br />
levels reach almost 170 ksi<br />
without the 550 F bake. With<br />
this magnitude <strong>of</strong> residual<br />
tensile stress, the ID runs the<br />
risk <strong>of</strong> cracking if baking is<br />
not done immediately.<br />
No Bake<br />
Depth S tress<br />
0.0000 75.6<br />
0.0005 109.6<br />
0.0014 149.6<br />
0.0020 150.1<br />
0.0029 167.9<br />
0.0039 159.6<br />
0.0057 150.6<br />
0.0077 172.3<br />
0.0101 157.6<br />
W ith Bake<br />
Depth S tress<br />
0.0000 58.6<br />
0.0005 49.6<br />
0.0011 47.3<br />
0.0021 69.3<br />
0.0029 65.6<br />
0.0039 64.8<br />
0.0051 80.1<br />
0.0071 88.9<br />
0.0103 63.2<br />
It should be noted that the residual tensile stresses formed on the ID <strong>of</strong> the spring are<br />
created as it is coiled from yielding <strong>of</strong> the ID in compression as the ID is squeezed while<br />
the OD is stretched. This mechanism is essentially the opposite mechanism <strong>of</strong> how the<br />
compressive stresses are formed from shot peening. The post bake reduces the tensile<br />
stress by over 100 ksi at some depths which is significant in terms <strong>of</strong> fatigue life.
The “As Coiled & Baked” springs were tested for spring load <strong>and</strong> also fatigue tested.<br />
This data is considered the control from which the other manufacturing techniques will<br />
be compared. Please note the following results.<br />
· <strong>Spring</strong> Load: 405.5 lbs @ a length <strong>of</strong> 3.25”<br />
· Fatigue Test: 80,679 cycles (average <strong>of</strong> 4 spring failures) with a 1.25” working<br />
stroke. The oscillating stress ranged from a calculated 50 ksi <strong>and</strong> 137 ksi. Additional<br />
fatigue test parameters are listed in Appendix D.<br />
(Single) Shot Peened <strong>Spring</strong>s<br />
Using the control lot <strong>of</strong> springs a number <strong>of</strong> springs were then shot peened using a 0.023”<br />
diameter media at a 0.016-0.020” A intensity. The following photograph is a S.E.M.<br />
photo (courtesy <strong>of</strong> Metallurgical Associates; Waukesha, WI) at 30 times magnification <strong>of</strong><br />
ID <strong>of</strong> the coil. One notes it as<br />
being uniformly “dimpled”<br />
from the peening process. In<br />
addition to inducing a<br />
compressive layer onto the<br />
surface <strong>of</strong> the spring, the<br />
tooling mark present in the<br />
previous S.E.M. photo has<br />
been obliterated eliminating<br />
the most likely crack initiation<br />
site.<br />
The following graph shows<br />
two curves for the (single)<br />
shot peened spring. One<br />
curve has the 400 F bake<br />
following shot peening <strong>and</strong> one curve does not have the bake. Please note the baking<br />
after shot peening is 400 F versus 550 F for coiling. One notes that the residual stresses<br />
without the bake are reduced slightly in both the compressive layer <strong>and</strong> tensile sub layer.<br />
Residual Stress (ksi)<br />
150.0<br />
100.0<br />
50.0<br />
0.0<br />
-50.0<br />
-100.0<br />
-150.0<br />
-200.0<br />
Single Peen - With & Without Bake<br />
0.000 0.002 0.004 0.006 0.008 0.010 0.012<br />
Depth (inches)<br />
W ithout B ake W ith Bake<br />
- 8 -<br />
No Bake<br />
Depth S tress<br />
0.0000 -99.5<br />
0.0004 -120.2<br />
0.0012 -154.7<br />
0.0020 -146.8<br />
0.0032 -135.8<br />
0.0040 -124.6<br />
0.0051 -65.4<br />
0.0069 55.0<br />
0.0106 132.1<br />
W ith Bake<br />
Depth S tress<br />
0.0000 -89.4<br />
0.0005 -107.0<br />
0.0011 -115.5<br />
0.0022 -124.5<br />
0.0031 -124.4<br />
0.0043 -89.3<br />
0.0051 -66.8<br />
0.0071 80.5<br />
0.0103 118.4
This would be expected as the baking operation would slightly relieve residual,<br />
compressive stress levels.<br />
The maximum compressive stress is ~ 0.002” below the surface <strong>and</strong> has a magnitude <strong>of</strong> ~<br />
125 ksi after the bake. This is a tremendous reduction in tensile stress versus the residual<br />
tensile stress present in the “St<strong>and</strong>ard/Control” spring. The reduction <strong>of</strong> tensile stress is ~<br />
150 ksi at the surface <strong>and</strong> ~ 195 ksi at 0.002” below the surface. Fatigue testing showed<br />
5,000,000 cycles with no failures at which point the test was stopped due to time<br />
constraints.<br />
It is important to note that the higher cycle the fatigue prior to shot peening (hence less<br />
net tensile stress), the greater the improvement in fatigue life. This is because lower<br />
cycle fatigue is on the left <strong>of</strong> the S-N graph horizontal axis. The S-N curve is much more<br />
vertical in the low cycle region which means less movement on the horizontal axis with a<br />
given reduction <strong>of</strong> tensile stress. If this same spring had only acquired 30,000 cycles<br />
without shot peening, it may have only obtained 90,000 cycles with shot peening. This is<br />
a 300% improvement versus the minimum 5000% demonstrated in fatigue testing this<br />
spring.<br />
The (single) shot peened springs were fatigue tested <strong>and</strong> also tested for spring load.<br />
Please note the following results.<br />
· <strong>Spring</strong> Load: 400.7 lbs @ a length <strong>of</strong> 3.25”<br />
· Fatigue Test: 5,000,000+ cycles (No failures recorded with 4 springs tested) with a<br />
1.25” working stroke. The oscillating stress ranged from a calculated 50 ksi <strong>and</strong> 137<br />
ksi. Additional fatigue test parameters are listed at the end <strong>of</strong> the paper.<br />
Double Shot Peened <strong>Spring</strong>s<br />
When the fatigue life <strong>of</strong> a single shot peened fine wire spring is inadequate, shot peening<br />
a second time with identical peening parameters (Double Peening) has been found to<br />
increase the number <strong>of</strong> cycles before failure will occur. The smallest steel shot media is<br />
0.007” in diameter <strong>and</strong> the wire diameter being shot peened should be at least four times<br />
the shot diameter. Please note the importance <strong>of</strong> baking after each shot peening operation<br />
discussed previously.<br />
It may also be necessary to limit the lot size in order to get adequate peening coverage.<br />
An example would be a 300,000 piece order that would be shot peened in three 100,000<br />
piece lots for insurance <strong>of</strong> maximum coverage. A possible reason for the increase in<br />
fatigue life with Double Peening is the “homogenizing” effect that takes place when the<br />
parts are thoroughly mixed. This happens when they are transferred from the first shot<br />
peen operation to the baking baskets <strong>and</strong> then to second shot peen operation which is then<br />
baked a final time.<br />
- 9 -
For this part <strong>of</strong> the study, additional compression springs were made <strong>of</strong> a smaller<br />
geometry & wire diameter. This was done to increase the amount <strong>of</strong> fatigue testing<br />
which could be performed.<br />
· <strong>Spring</strong> Load: 395.6 lbs @ a length <strong>of</strong> 3.25” (St<strong>and</strong>ard/Control <strong>Spring</strong>)<br />
· Fatigue Tests (using smaller springs): No Shot Peening – 186,000<br />
Single Shot Peening – 1,048,000<br />
Double Shot Peening – 2,159,000<br />
Dual Shot Peened <strong>Spring</strong>s<br />
The purpose <strong>of</strong> dual peening is to increase the compressive stress at the outer surface<br />
(depth = 0.000”) with a secondary peening operation. By further compressing the outer<br />
surface, initiation <strong>of</strong> a fatigue crack becomes more difficult. The second peen was<br />
performed with a 0.011” diameter shot at 0.008-0.010” A intensity. Since this is a lower<br />
intensity, there will be no change to the depth <strong>of</strong> the compressive layer. It would take a<br />
greater intensity, which has more energy to drive in a deeper depth <strong>of</strong> compression. The<br />
dual peen was performed to a batch <strong>of</strong> (single) shot peened springs following the initial<br />
post shot peening bake at 400 F.<br />
The reason that dual peening improves the surface compressive stress is that its<br />
compressive stress is a proportional to the disruption or dimpling <strong>of</strong> the surface. A<br />
properly shot peened surface has a uniform dimpled appearance. The surface consists <strong>of</strong><br />
high points <strong>and</strong> lower plateaus. These are the result <strong>of</strong> the surface material being<br />
displaced as the peening media impacts it. A more aggressive peening operation (higher<br />
intensity) will result in larger dimples. The high points are less compressed than the<br />
lower plateaus.<br />
The secondary peening operation is done with a smaller diameter media. The smaller<br />
media is able to compact the high points left from the first peening operation. The dual<br />
peening leaves a uniformly dimpled surface, but the high points are reduced from the first<br />
peening operation. This results in a finer surface finish <strong>and</strong> a more compressed top<br />
surface layer.<br />
- 10 -<br />
This photograph is a<br />
S.E.M. photo (courtesy <strong>of</strong><br />
Metallurgical Associates;<br />
Waukesha, WI) which<br />
shows the ID <strong>of</strong> the coil<br />
(30x magnification)<br />
following dual peening.<br />
The surface finish is less<br />
aggressive, having more<br />
dimples which are smaller<br />
in size than the previous<br />
photo <strong>of</strong> a single shot<br />
peened spring.
The following graph shows two curves. One curve show shows the compressive stress<br />
from single shot peening <strong>and</strong> the other shows the dual peening. It should be noted that<br />
the surface (depth = 0.000”) is compressed ~ 14 ksi further with the dual peening process.<br />
Due to time constraints, fatigue testing was not performed to the dual peened springs.<br />
Residual Stress (ksi)<br />
0.0<br />
-30.0<br />
-60.0<br />
-90.0<br />
-120.0<br />
-150.0<br />
-180.0<br />
Single & Dual Peen<br />
0.000 0.002 0.004 0.006 0.008<br />
Depth (inches)<br />
S ingle P een Dual P een<br />
It should be noted that there is a difference in the maximum compressive stress when<br />
they should be identical. This is because the single peen curve is showing the residual<br />
stress without the post bake. If the single peen with post bake was shown, the maximum<br />
compressive stress would be very similar to the dual peen.<br />
One could expect a noticeable increase in fatigue life with dual peening. This applies to a<br />
14 ksi improvement. One notes in the S-N curve that the high cycle fatigue portions <strong>of</strong><br />
the curve have very large increases in fatigue properties with a decrease in tensile stress.<br />
<strong>Spring</strong> load checks for the dual peening yielded the following:<br />
· <strong>Spring</strong> Load: 397.6 lbs @ a length <strong>of</strong> 3.25”<br />
· Fatigue Test: Not performed at this time<br />
Superfinished (without shot peening) <strong>Spring</strong>s<br />
It is a well known fact that surfaces that are subject to fatigue failure perform better when<br />
they have better surface finishes. This is because a better surface finish has less<br />
pronounced surface irregularities for fatigue cracks to initiate.<br />
For this technical study, two sets <strong>of</strong> springs were superfinished. The superfinishing was<br />
Metal Improvement Company’s C.A.S.E. SM process. This is an acronym for Chemically<br />
Assisted Surface Engineering <strong>and</strong> is primarily applied in situations where both fatigue<br />
- 11 -<br />
S ingle<br />
Depth S tress<br />
0.0000 -99.5<br />
0.0004 -120.2<br />
0.0012 -154.7<br />
0.0020 -146.8<br />
0.0032 -135.8<br />
0.0040 -124.6<br />
0.0051 -65.4<br />
0.0069 55.0<br />
0.0106 132.1<br />
Depth<br />
Dual<br />
S tress<br />
0.0000 -113.4<br />
0.0006 -121.3<br />
0.0011 -140.5<br />
0.0021 -133.8<br />
0.0029 -131.3<br />
0.0043 -109.7<br />
0.0050 -64.2<br />
0.0070 76.3<br />
0.0101 165.2
<strong>and</strong> contact/pitting failures are a concern. The process is a vibratory honing process<br />
performed in a chemical solution to accelerate the process. The most common example<br />
is gearing for racing applications.<br />
The superfinishing was included as part <strong>of</strong> this study because it is believed there have<br />
been no studies performed on spring performance <strong>and</strong> this type <strong>of</strong> process. Two lots <strong>of</strong><br />
springs were superfinished. One lot was the as coiled condition <strong>and</strong> the other lot was<br />
performed after (single) shot peening.<br />
The following photograph is a S.E.M. photo (courtesy Metallurgical Associates;<br />
Waukesha, WI) which shows the ID <strong>of</strong> the spring after superfinishing (at 30x<br />
magnification). The residual<br />
stress levels are discussed in the<br />
following section. One can see<br />
some <strong>of</strong> the remains <strong>of</strong> the<br />
original tooling mark. Visually<br />
the springs have an attractive,<br />
mirror finish as shown in the<br />
subsequent photograph.<br />
- 12 -<br />
A batch <strong>of</strong> these springs was<br />
fatigue tested. The results show<br />
that an average <strong>of</strong> 81,100 cycles<br />
happened before failure under<br />
the same test as the<br />
St<strong>and</strong>ard/Control springs. When<br />
comparing this to the<br />
St<strong>and</strong>ard/Control<br />
springs, they have<br />
almost identical<br />
fatigue lives. This is<br />
good pro<strong>of</strong> that these<br />
fatigue failures can be<br />
attributed to the<br />
residual tensile<br />
stresses that are<br />
present on the ID from<br />
coiling more so than<br />
the tooling mark as a<br />
result <strong>of</strong> the coiling.<br />
The graph showing the residual stress levels from this process is described in the next<br />
section. Please note the test results from the Superfinished (only) springs.<br />
· <strong>Spring</strong> Load: 403.1 lbs @ a length <strong>of</strong> 3.25”<br />
· Fatigue Test: 81,100 cycles with a 1.25” working stroke.
Shot Peened & Superfnished <strong>Spring</strong>s<br />
The C.A.S.E. SM process described in the previous section is normally performed<br />
following shot peening. The uniform, stock removal from the vibratory honing process<br />
removes several tenths <strong>of</strong> a thous<strong>and</strong>ths <strong>of</strong> an inch (~ 0.0001” - 0.0003”) depending on<br />
the material, hardness, <strong>and</strong> processing time. Recall this outer location <strong>of</strong> the surface is<br />
less compressed than slightly below the surface. Since shot peening leaves a uniform<br />
surface finish, the superfinishing works very well following shot peening.<br />
Visually, the springs have the same mirror finish (see previous photograph) whether shot<br />
peened or not prior to the superfinishing. The following graph shows the difference in<br />
residual stress <strong>of</strong> both superfinished springs. It should be noted that throughout the depth<br />
shown on the graph, residual stress levels are in a much more compressed stated with the<br />
shot peened spring.<br />
Residual Stress (ksi)<br />
150.0<br />
100.0<br />
50.0<br />
0.0<br />
-50.0<br />
-100.0<br />
-150.0<br />
C.A.S.E. With & Without Peen<br />
0.000 0.002 0.004 0.006 0.008 0.010 0.012<br />
Depth (inches)<br />
C.A.S .E . - No P een C.A.S .E . - W ith Peen<br />
- 13 -<br />
C.A.S .E - No P een<br />
Depth S tress<br />
0.0000 -24.8<br />
0.0004 44.4<br />
0.0010 79.2<br />
0.0022 97.0<br />
0.0039 104.0<br />
0.0045 105.1<br />
0.0052 108.4<br />
0.0072 105.2<br />
0.0098 109.1<br />
C.A.S .E - W ith P een<br />
Depth S tress<br />
0.0000 -94.9<br />
0.0005 -99.4<br />
0.0010 -105.5<br />
0.0019 -119.0<br />
0.0030 -84.1<br />
0.0045 -49.9<br />
0.0050 -31.9<br />
0.0069 47.0<br />
0.0098 94.2<br />
There is ~ 70 ksi more compressive stress at the surface <strong>and</strong> ~ 223 ksi difference in<br />
residual stress at 0.002” below the surface. Please note the extremely shallow<br />
compressive layer on the non-shot peened spring which would <strong>of</strong>fer little fatigue<br />
protection. This is because only 0.0001” - 0.0003” <strong>of</strong> stock was removed from the<br />
St<strong>and</strong>ard/Control springs which had much deeper, residual tensile stresses with very high<br />
magnitudes. This is why the Superfinished spring without prior shot peening performed<br />
the same as the St<strong>and</strong>ard/Control springs.<br />
For these reasons one could expect superior fatigue performance from a C.A.S.E. SM<br />
processed spring with prior shot peening. Fatigue testing was performed <strong>and</strong> stopped at<br />
5,000,000 cycles with no failures. Though fatigue testing was not completed, one would
anticipate results to be better than a (single) shot peened spring <strong>and</strong> similar to (or better<br />
than) the dual peened springs, which also were not fatigue tested.<br />
· <strong>Spring</strong> Load: 396.4 lbs @ a length <strong>of</strong> 3.25”<br />
· Fatigue Test: 5,000,000+ cycles (No failures recorded with 4 springs tested) with a<br />
1.25” working stroke.<br />
Strain Peened <strong>Spring</strong>s<br />
Strain peening is a type <strong>of</strong> peening in which the part is physically loaded prior to shot<br />
peening. The intent is to increase the magnitude <strong>of</strong> the maximum compressive stress.<br />
This, again, is the value <strong>of</strong> the compressive stress at 0.001” - 0.002” below the surface.<br />
This value is a function <strong>of</strong> the base material properties <strong>and</strong> should be the same regardless<br />
<strong>of</strong> the (non-strain peened) shot peening parameters. The theory as to how this happens<br />
with strain peening is as follows.<br />
Using traditional shot peening, the compressive stress is formed from the impact <strong>of</strong> the<br />
media stretching the surface beyond its yield point in tension. With strain peening, the<br />
part is loaded such that there is a tensile stress on the surface prior to shot peening. When<br />
the media impacts the surface, the surface yields further in tension from both the impact<br />
<strong>and</strong> physical loading. This results in a greater maximum value <strong>of</strong> compressive stress.<br />
For this technical study, a lot <strong>of</strong> extension springs were coiled <strong>and</strong> baked from the same<br />
heat lot <strong>of</strong> spring wire as the compression springs (photo on page 7). Extension springs<br />
were chosen because they are much easier to apply a load to for strain peening. The<br />
springs were stretched 1.125” for the shot/strain peening. This allows enough room for<br />
the shot to travel through the coils to peen the ID. They were peened to the same<br />
intensity as the compression springs (0.016-0.020” A). The following graph shows an<br />
extension spring that was strain peened (with post bake) along with another extension<br />
spring (with bake) after coiling with no shot/strain peening.<br />
Residual Stress (ksi)<br />
150.0<br />
100.0<br />
50.0<br />
0.0<br />
-50.0<br />
-100.0<br />
-150.0<br />
Strain Peen vs No Peen<br />
0.000 0.002 0.004 0.006 0.008<br />
Depth (inches)<br />
E xt. S pring ID - Coiled/B aked E xt. S pring ID - S train P een<br />
- 14 -<br />
E xtension S pring - ID<br />
Coiled/B aked/No P een<br />
Depth S tress<br />
0.0000 76.3<br />
0.0004 79.1<br />
0.0012 81.5<br />
0.0021 80.1<br />
0.0032 91.9<br />
0.0041 82.2<br />
0.0053 91.5<br />
0.0071 88.0<br />
E xtension S pring - ID<br />
S train P een & Bake<br />
Depth S tress<br />
0.0000 -64.5<br />
0.0004 -83.1<br />
0.0010 -107.6<br />
0.0022 -128.5<br />
0.0030 -130.4<br />
0.0042 -104.0<br />
0.0051 -40.7<br />
0.0072 76.3<br />
0.0098 118.5
What is interesting to note in the graph is that the magnitude <strong>of</strong> the maximum<br />
compressive stress is almost identical to the (single) shot peened springs when it was<br />
expected to be higher. This is not necessarily true. What one must look at more closely<br />
is that the coiling <strong>of</strong> the extension springs (after bake) induced ~ 20 – 30 ksi more<br />
residual tensile stress than the St<strong>and</strong>ard/Control springs (with bake). This means that the<br />
strain peening had to induce 20 – 30 ksi more compressive stress such that the results<br />
would be very close to the (single) shot peening.<br />
One could expect significant fatigue improvements with strain peening over conventional<br />
shot peening, dual peening, or superfinishing. Please note though that there is the most<br />
significant decrease in spring load with strain peening to accompany this excellent<br />
improvement. The reason for the significant improvement is that both the surface stress<br />
<strong>and</strong> maximum compressive stress are increased by 20 – 30 ksi rather than just the surface<br />
stress with dual peening.<br />
It should be noted that strain peening <strong>of</strong> springs is not a common practice. The main<br />
reason is that it is cost prohibitive due to the labor <strong>and</strong> fixturing required to stretch the<br />
springs for shot peening.<br />
For comparison purposes spring load inspections were taken at an extension <strong>of</strong> 6.76” to a<br />
non-shot peened, conventional shot peened, <strong>and</strong> strain peened extension springs. One<br />
notes a large drop in spring load with the strain peened spring.<br />
· <strong>Spring</strong> Load - No Shot Peening: 180.2 lbs @ a length <strong>of</strong> 6.76”<br />
· <strong>Spring</strong> Load - Conventional Shot Peening: 175.9 lbs @ a length <strong>of</strong> 6.76”<br />
· <strong>Spring</strong> Load - Stain Peening: 160.8 lbs @ a length <strong>of</strong> 6.76”<br />
· Fatigue Tests: Not performed at this time<br />
Additional <strong>Spring</strong> & Wire Data<br />
· Material: Oil Tempered Chrome Silicon Wire in accordance with ASTM-A-401-93<br />
· Wire Diameter: 0.250”<br />
· Tensile Strength: 258.5 – 262 ksi<br />
· Free Length: 5.207”(calculated)<br />
· Outer Diameter: 2.000” ± .040”<br />
· Active Coils: 5.18 (calculated)<br />
· Total Coils: 7.18 (calculated)<br />
· <strong>Spring</strong> Rate: 202.4 lbs/inch (calculated)<br />
· Helix Angle: 9.39 Degrees<br />
- 15 -
Additional Fatigue Test Data<br />
· For the fatigue test, 4 springs were cycle tested at 3.333 Hz (12,000 cycles/hour).<br />
· The free length <strong>of</strong> the spring was 5.21”<br />
· The upper displacement limit <strong>of</strong> the fatigue test was 4.50” which results in a<br />
calculated load stress <strong>of</strong> 49,500 psi.<br />
· The lower displacement limit <strong>of</strong> the fatigue test 3.25” which results in a calculated<br />
stress <strong>of</strong> 137,000 psi.<br />
· The 4 springs were placed in a fixture designed to insure equal loading around the<br />
center <strong>of</strong> the ram that actuated the test.<br />
· Results <strong>of</strong> St<strong>and</strong>ard/Control springs: 47,005 66,402 99,800 109,510 cycles.<br />
· Results <strong>of</strong> Superfinished (no shot peening) springs: 70,700 72,700 85,400 95,600<br />
cycles.<br />
· Results <strong>of</strong> (single) shot peened springs: No failures @ 1,000,000 cycles<br />
· Results <strong>of</strong> Superfinised (with shot peening) springs: No failures @ 1,000,000 cycles<br />
Acknowledgements<br />
The co-authors <strong>of</strong> this paper would like to make special mention <strong>of</strong> all parties who were<br />
involved in this technical study. There were significant contributions <strong>of</strong> technician labor<br />
shop resources from the contributing parties in addition to the logging <strong>and</strong> tracking <strong>of</strong><br />
large amounts <strong>of</strong> data.<br />
· All spring design, materials, coiling, baking, load testing, & fatigue testing.<br />
Wisconsin Coil <strong>Spring</strong>, Inc.<br />
Muskego, WI (414) 422-2000<br />
· All shot peening & strain peening.<br />
Metal Improvement Company, Inc.<br />
Milwaukee, WI (414) 355-6119<br />
· All x-ray diffraction<br />
Lambda Research, Inc.<br />
Cincinnati, OH (513) 561-0883<br />
· All Scanning Electron Microscopy Photographs<br />
Metallurgical Associates, Inc.<br />
Waukesha, WI (414) 798-8098<br />
· All Superfinishing/Polishing<br />
Metal Improvement Company, Inc.<br />
Bloomfield, CT (860) 243-2220<br />
- 16 -
References<br />
(1) P. S. Prevéy, Metals H<strong>and</strong>book., Vol. 10, 1986, 380-392.<br />
(2) M. E. Hilley, ed., "Residual Stress Measurement by X-Ray Diffraction," SAE J784a,<br />
Society <strong>of</strong> Automotive Engineers, Warrendale, PA (1971).<br />
(3) ASTM, "St<strong>and</strong>ard Method for Verifying the Alignment <strong>of</strong> X-Ray Diffraction<br />
Instrumentation for Residual Stress Measurement," E915, Vol. 3.01, Philadelphia, PA,<br />
809-812, (1984).<br />
(4) ASTM, "St<strong>and</strong>ard Test Method for Determining the Effective Elastic Parameter for<br />
X-Ray Diffraction Measurements <strong>of</strong> Residual Stress" E1426-94, Vol. 3.01, Philadelphia,<br />
PA, pp** (1994).<br />
(5) P. S. Prevey, Adv. in X-Ray Anal., Vol. 29, 1986, pp. 103-111.<br />
(6) P. S. Prevey, Adv. in X-Ray Anal., Vol. 20, 1977, pp. 345-354.<br />
(7) D. P. Koistinen <strong>and</strong> R. E. Marburger, Trans. ASM, Vol. 51, 1959, pp. 537-550.<br />
(8) M. G. Moore <strong>and</strong> W. P. Evans, Trans. SAE, Vol. 66, 1958, pp. 340-345.<br />
- 17 -