

EPSDtechintplan2004
EPSDtechintplan2004
EPSDtechintplan2004

You also want an ePaper? Increase the reach of your titles
YUMPU automatically turns print PDFs into web optimized ePapers that Google loves.
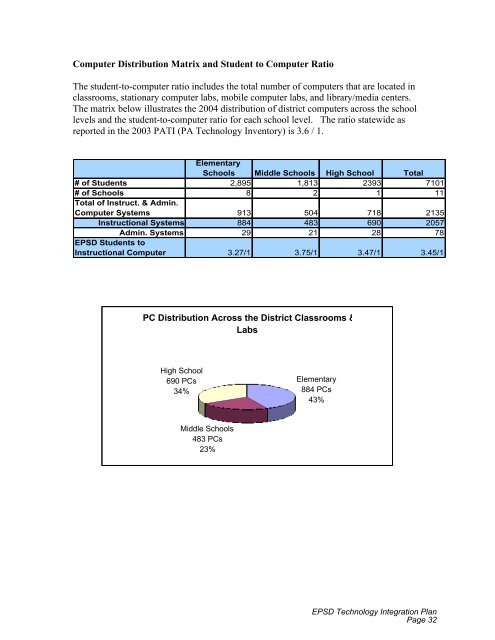
Computer Distribution Matrix and Student to Computer Ratio<br />
The student-to-computer ratio includes the total number of computers that are located in<br />
classrooms, stationary computer labs, mobile computer labs, and library/media centers.<br />
The matrix below illustrates the 2004 distribution of district computers across the school<br />
levels and the student-to-computer ratio for each school level. The ratio statewide as<br />
reported in the 2003 PATI (PA Technology Inventory) is 3.6 / 1.<br />
Elementary<br />
Schools Middle Schools High School Total<br />
# of Students 2,895 1,813 2393 7101<br />
# of Schools 8 2 1 11<br />
Total of Instruct. & Admin.<br />
Computer Systems 913 504 718 2135<br />
Instructional Systems 884 483 690 2057<br />
Admin. Systems 29 21 28 78<br />
EPSD Students to<br />
Instructional Computer 3.27/1 3.75/1 3.47/1 3.45/1<br />
PC Distribution Across the District Classrooms &<br />
Labs<br />
High School<br />
690 PCs<br />
34%<br />
Middle Schools<br />
483 PCs<br />
23%<br />
Elementary<br />
884 PCs<br />
43%<br />
EPSD Technology Integration Plan<br />
Page 32