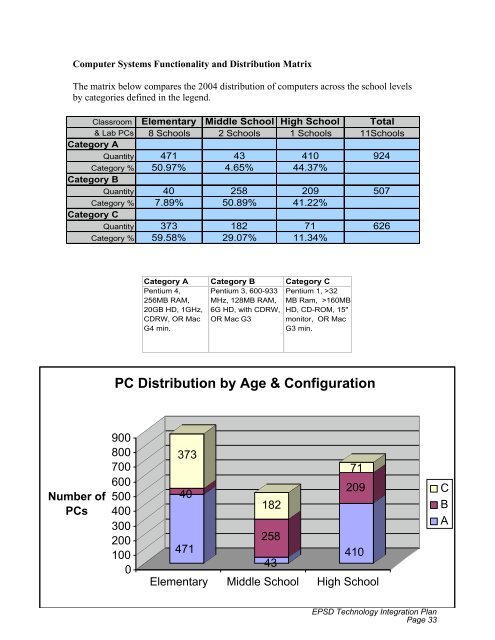
Computer Systems Functionality and Distribution Matrix The matrix below compares the 2004 distribution of computers across the school levels by categories defined in the legend. Classroom Elementary Middle School High School Total & Lab PCs 8 Schools 2 Schools 1 Schools 11Schools Category A Quantity 471 43 410 924 Category % 50.97% 4.65% 44.37% Category B Quantity 40 258 209 507 Category % 7.89% 50.89% 41.22% Category C Quantity 373 182 71 626 Category % 59.58% 29.07% 11.34% Number of PCs Category A Category B Category C Pentium 4, 256MB RAM, 20GB HD, 1GHz, CDRW, OR Mac G4 min. 373 40 471 Pentium 3, 600-933 MHz, 128MB RAM, 6G HD, with CDRW, OR Mac G3 182 258 43 Pentium 1, >32 MB Ram, >160MB HD, CD-ROM, 15" monitor, OR Mac G3 min. PC Distribution by Age & Configuration 900 800 700 600 500 400 300 200 100 0 71 209 410 Elementary Middle School High School EPSD Technology Integration Plan Page 33 C B A
Technology Budget Analysis The 2003-04 budget allocated 53% of funds for replacement equipment and 17% for new equipment in classrooms and administrative offices. Replacing classroom and lab computers with more powerful desktop and laptop computers supports the increasing complexity of graphics oriented, highly interactive academic software programs that enhance the curriculum and expand the learning experience far beyond the walls of the traditional classroom. The Curriculum Revision Cycle presents opportunities to improve curriculum as guided by state standards while exploring appropriate academic technology to support classroom and academic goals. Transitioning from the Service Bureau Model of the CLIU to the Application Service Provider model of Pentamation has necessitated a sweeping cultural change as the district assumed the responsibility for the statistical manipulation of data necessary for in-district production of reports (state reports, report cards, transcripts, etc.) that had formerly been provided by the CLIU support staff. Replacing office computers and introducing highoutput printers, as well as providing teacher workstations, were requirements for the implementation of the student management system. Training, support and customization continue to be critical components for the long-term success of the transition. Noting the following chart, funding for the student management system is included in the categories Software, Support Services, and Contracts. 2003-2004 Information Technology Budget Support Services Contracts and Repairs Software & Supplies New Equipment Replacement Equipment Mileage, Post., Misc. Totals Elementary Classrooms $30,000.00 $5,000.00 $14,000.00 $53,300.00 $310,000.00 $900.00 $413,200.00 Secondary Classrooms $22,000.00 $7,000.00 $13,500.00 $53,300.00 $125,000.00 $500.00 $221,300.00 Offices (IT, Admin, Bldgs.) $5,000.00 $2,000.00 $118,000.00 $25,000.00 $48,200.00 $4,500.00 $202,700.00 Networking (Infrastructure) $10,200.00 $43,000.00 $30,000.00 $27,000.00 $40,000.00 $900.00 $151,100.00 Additional LCD projectors were distributed to all schools, supplying at least one projector per department, pod, team, or grade, depending upon the logistical setup of the school. School libraries continue to act as distribution points for shared projectors on an as-needed basis. Palm Pilots, digital cameras, scanners, software, and additional printers were placed throughout the district in response to the requests of teachers incorporating the use of digital photography and video-editing as students produce graphically enhanced projects. Where needed throughout the district, television sets were replaced with new models, to provide classroom access to satellite programming and educational cable TV. EPSD Technology Integration Plan Page 34