Annual Report 2012 pdf (5 MB) - Deutsche Post DHL
Annual Report 2012 pdf (5 MB) - Deutsche Post DHL
Annual Report 2012 pdf (5 MB) - Deutsche Post DHL

Create successful ePaper yourself
Turn your PDF publications into a flip-book with our unique Google optimized e-Paper software.
DeutsCHe <strong>Post</strong> sHares<br />
Good year on the stock market<br />
At the beginning of the year, a positive sentiment prevailed in the equity markets due<br />
to the measures taken by the European Central Bank (ECB) to curb the sovereign debt<br />
crisis in Europe. The DAX also benefited from the comparatively positive performance<br />
of the German economy. However, over the course of the first half of the year, concerns<br />
over an economic crisis in Southern Europe rose and the global economy grew at a<br />
slower pace. This sent the international stock markets on a decline. The EURO STOXX 50<br />
and DAX each hit their annual low in June at 2,069 and 5,969 points, respectively. At the<br />
beginning of the second half of the year, the ECB announced additional measures and<br />
the German Federal Constitutional Court ruled in favour of the permanent euro rescue<br />
fund. Stock markets displayed renewed optimism and made considerable gains by the<br />
end of the year. The DAX reached its annual high of 7,672 points on 20 December <strong>2012</strong><br />
– its highest level since January 2008. It ended the year at 7,612 points – a 29.1 % gain.<br />
The EURO STOXX 50 was up 13.8 % year-on-year. The Dow Jones closed <strong>2012</strong> with a gain<br />
of 7.3 % on account of the slight recovery in the US economy.<br />
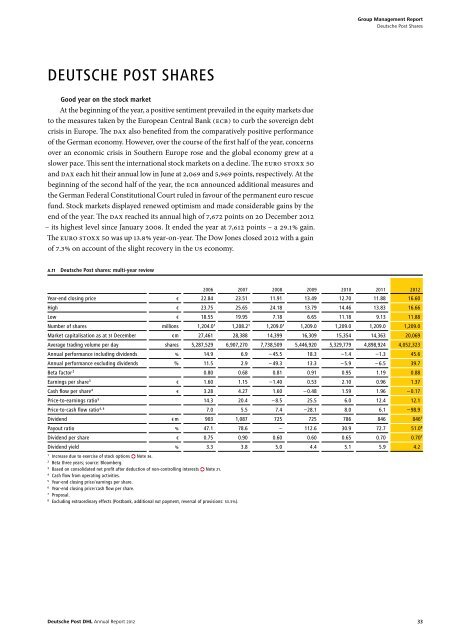
A.11 <strong>Deutsche</strong> <strong>Post</strong> shares: multi-year review<br />
2006 2007 2008 2009 2010 2011 <strong>2012</strong><br />
Year-end closing price € 22.84 23.51 11.91 13.49 12.70 11.88 16.60<br />
High € 23.75 25.65 24.18 13.79 14.46 13.83 16.66<br />
low € 18.55 19.95 7.18 6.65 11.18 9.13 11.88<br />
number of shares millions 1,204.0 1 1,208.2 1 1,209.0 1 1,209.0 1,209.0 1,209.0 1,209.0<br />
Market capitalisation as at 31 December € m 27,461 28,388 14,399 16,309 15,354 14,363 20,069<br />
average trading volume per day shares 5,287,529 6,907,270 7,738,509 5,446,920 5,329,779 4,898,924 4,052,323<br />
annual performance including dividends % 14.9 6.9 – 45.5 18.3 –1.4 –1.3 45.6<br />
annual performance excluding dividends % 11.5 2.9 – 49.3 13.3 – 5.9 – 6.5 39.7<br />
beta factor ² 0.80 0.68 0.81 0.91 0.95 1.19 0.88<br />
earnings per share 3 € 1.60 1.15 –1.40 0.53 2.10 0.96 1.37<br />
Cash flow per share 4 € 3.28 4.27 1.60 – 0.48 1.59 1.96 – 0.17<br />
Price-to-earnings ratio 5 14.3 20.4 – 8.5 25.5 6.0 12.4 12.1<br />
Price-to-cash flow ratio 4, 6 7.0 5.5 7.4 –28.1 8.0 6.1 – 98.9<br />
Dividend € m 903 1,087 725 725 786 846 846 7<br />
Payout ratio % 47.1 78.6 – 112.6 30.9 72.7 51.0 8<br />
Dividend per share € 0.75 0.90 0.60 0.60 0.65 0.70 0.70 7<br />
Dividend yield % 3.3 3.8 5.0 4.4 5.1 5.9 4.2<br />
1 increase due to exercise of stock options note 36.<br />
2 beta three years; source: bloomberg.<br />
3 based on consolidated net profit after deduction of non-controlling interests note 21.<br />
4 Cash flow from operating activities.<br />
5 Year-end closing price / earnings per share.<br />
6 Year-end closing price / cash flow per share.<br />
7 Proposal.<br />
8 excluding extraordinary effects (<strong>Post</strong>bank, additional VAT payment, reversal of provisions: 53.3 %).<br />
<strong>Deutsche</strong> <strong>Post</strong> <strong>DHL</strong> <strong>Annual</strong> <strong>Report</strong> <strong>2012</strong><br />
Group Management <strong>Report</strong><br />
<strong>Deutsche</strong> <strong>Post</strong> Shares<br />
33