MIRVAC gRoup AnnuAl RepoRt 2012 - Mirvac - Mirvac Group
MIRVAC gRoup AnnuAl RepoRt 2012 - Mirvac - Mirvac Group
MIRVAC gRoup AnnuAl RepoRt 2012 - Mirvac - Mirvac Group

You also want an ePaper? Increase the reach of your titles
YUMPU automatically turns print PDFs into web optimized ePapers that Google loves.
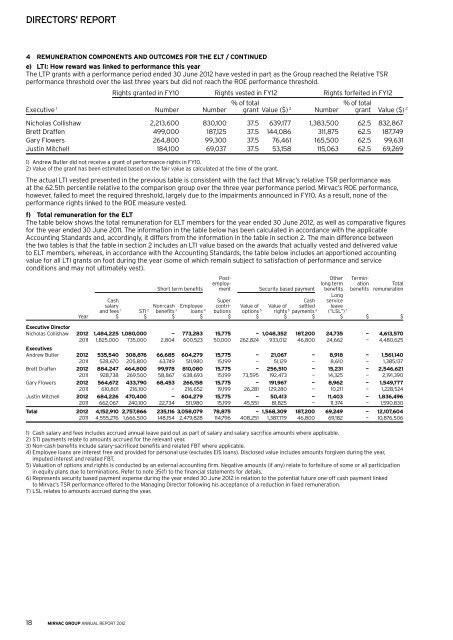
DIReCtoRs’ <strong>RepoRt</strong><br />
4 ReMuneRAtion coMponents AnD outcoMes foR the elt / continueD<br />
e) lti: how reward was linked to performance this year<br />
The LTP grants with a performance period ended 30 June <strong>2012</strong> have vested in part as the <strong>Group</strong> reached the Relative TSR<br />
performance threshold over the last three years but did not reach the Roe performance threshold.<br />
Rights granted in Fy10 Rights vested in Fy12 Rights forfeited in Fy12<br />
% of total % of total<br />
executive 1 Number Number grant value ($) 2 Number grant value ($) 2<br />
Nicholas Collishaw 2,213,600 830,100 37.5 639,177 1,383,500 62.5 832,867<br />
Brett Draffen 499,000 187,125 37.5 144,086 311,875 62.5 187,749<br />
Gary Flowers 264,800 99,300 37.5 76,461 165,500 62.5 99,631<br />
Justin Mitchell 184,100 69,037 37.5 53,158 115,063 62.5 69,269<br />
1) Andrew Butler did not receive a grant of performance rights in Fy10.<br />
2) value of the grant has been estimated based on the fair value as calculated at the time of the grant.<br />
The actual LTI vested presented in the previous table is consistent with the fact that <strong>Mirvac</strong>’s relative TSR performance was<br />
at the 62.5th percentile relative to the comparison group over the three year performance period. <strong>Mirvac</strong>’s Roe performance,<br />
however, failed to meet the required threshold, largely due to the impairments announced in Fy10. As a result, none of the<br />
performance rights linked to the Roe measure vested.<br />
f) total remuneration for the elt<br />
The table below shows the total remuneration for eLT members for the year ended 30 June <strong>2012</strong>, as well as comparative figures<br />
for the year ended 30 June 2011. The information in the table below has been calculated in accordance with the applicable<br />
Accounting Standards and, accordingly, it differs from the information in the table in section 2. The main difference between<br />
the two tables is that the table in section 2 includes an LTI value based on the awards that actually vested and delivered value<br />
to eLT members, whereas, in accordance with the Accounting Standards, the table below includes an apportioned accounting<br />
value for all LTI grants on foot during the year (some of which remain subject to satisfaction of performance and service<br />
conditions and may not ultimately vest).<br />
Post- other Terminemploy-<br />
long term ation Total<br />
Short term benefits ment Security based payment benefits<br />
Long<br />
benefits remuneration<br />
Cash Super Cash service<br />
salary Non-cash employee contri- value of value of settled leave<br />
and fees 1 STI 2 benefits 3 loans 4 butions options 5 rights 5 payments 6 (“LSL”) 7<br />
year $ $ $ $ $ $ $ $ $ $ $<br />
executive Director<br />
Nicholas Collishaw <strong>2012</strong> 1,484,225 1,080,000 — 773,283 15,775 — 1,048,352 187,200 24,735 — 4,613,570<br />
2011 1,825,000 735,000 2,804 600,523 50,000 262,824 933,012 46,800 24,662 — 4,480,625<br />
executives<br />
Andrew Butler <strong>2012</strong> 535,540 308,876 66,685 604,279 15,775 — 21,067 — 8,918 — 1,561,140<br />
2011 528,670 205,800 63,749 511,980 15,199 — 51,129 — 8,610 — 1,385,137<br />
Brett Draffen <strong>2012</strong> 884,247 464,800 99,978 810,080 15,775 — 256,510 — 15,231 — 2,546,621<br />
2011 928,738 269,500 58,867 638,693 15,199 73,595 192,473 — 14,325 — 2,191,390<br />
Gary Flowers <strong>2012</strong> 564,672 433,790 68,453 266,158 15,775 — 191,967 — 8,962 — 1,549,777<br />
2011 610,801 216,100 — 216,652 19,199 26,281 129,280 — 10,211 — 1,228,524<br />
Justin Mitchell <strong>2012</strong> 684,226 470,400 — 604,279 15,775 — 50,413 — 11,403 — 1,836,496<br />
2011 662,067 240,100 22,734 511,980 15,199 45,551 81,825 — 11,374 — 1,590,830<br />
total <strong>2012</strong> 4,152,910 2,757,866 235,116 3,058,079 78,875 — 1,568,309 187,200 69,249 — 12,107,604<br />
2011 4,555,276 1,666,500 148,154 2,479,828 114,796 408,251 1,387,719 46,800 69,182 — 10,876,506<br />
1) Cash salary and fees includes accrued annual leave paid out as part of salary and salary sacrifice amounts where applicable.<br />
2) STI payments relate to amounts accrued for the relevant year.<br />
3) Non-cash benefits include salary-sacrificed benefits and related FBT where applicable.<br />
4) employee loans are interest free and provided for personal use (excludes eIS loans). Disclosed value includes amounts forgiven during the year,<br />
imputed interest and related FBT.<br />
5) valuation of options and rights is conducted by an external accounting firm. Negative amounts (if any) relate to forfeiture of some or all participation<br />
in equity plans due to terminations. Refer to note 35(f) to the financial statements for details.<br />
6) Represents security based payment expense during the year ended 30 June <strong>2012</strong> in relation to the potential future one-off cash payment linked<br />
to <strong>Mirvac</strong>’s TSR performance offered to the Managing Director following his acceptance of a reduction in fixed remuneration.<br />
7) LSL relates to amounts accrued during the year.<br />
18 mirvac group annual report <strong>2012</strong>