MIRVAC gRoup AnnuAl RepoRt 2012 - Mirvac - Mirvac Group
MIRVAC gRoup AnnuAl RepoRt 2012 - Mirvac - Mirvac Group
MIRVAC gRoup AnnuAl RepoRt 2012 - Mirvac - Mirvac Group
You also want an ePaper? Increase the reach of your titles
YUMPU automatically turns print PDFs into web optimized ePapers that Google loves.
DIReCtoRs’ <strong>RepoRt</strong><br />
Review of opeRAtions AnD Activities / continueD<br />
02 mirvac group annual report <strong>2012</strong><br />
<strong>2012</strong> 2011<br />
$m $m<br />
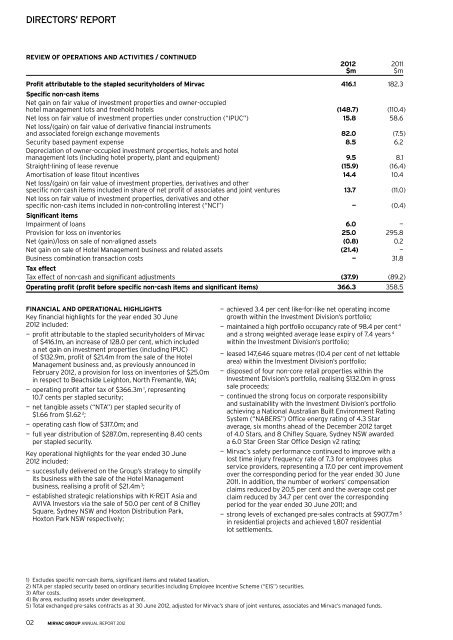
profit attributable to the stapled securityholders of <strong>Mirvac</strong> 416.1 182.3<br />
specific non-cash items<br />
Net gain on fair value of investment properties and owner-occupied<br />
hotel management lots and freehold hotels (148.7) (110.4)<br />
Net loss on fair value of investment properties under construction (“IPuC”)<br />
Net loss/(gain) on fair value of derivative financial instruments<br />
15.8 58.6<br />
and associated foreign exchange movements 82.0 (7.5)<br />
Security based payment expense<br />
Depreciation of owner-occupied investment properties, hotels and hotel<br />
8.5 6.2<br />
management lots (including hotel property, plant and equipment) 9.5 8.1<br />
Straight-lining of lease revenue (15.9) (16.4)<br />
Amortisation of lease fitout incentives<br />
Net loss/(gain) on fair value of investment properties, derivatives and other<br />
14.4 10.4<br />
specific non-cash items included in share of net profit of associates and joint ventures<br />
Net loss on fair value of investment properties, derivatives and other<br />
13.7 (11.0)<br />
specific non-cash items included in non-controlling interest (“NCI”)<br />
significant items<br />
— (0.4)<br />
Impairment of loans 6.0 —<br />
Provision for loss on inventories 25.0 295.8<br />
Net (gain)/loss on sale of non-aligned assets (0.8) 0.2<br />
Net gain on sale of hotel Management business and related assets (21.4) —<br />
Business combination transaction costs<br />
tax effect<br />
— 31.8<br />
Tax effect of non-cash and significant adjustments (37.9) (89.2)<br />
operating profit (profit before specific non-cash items and significant items) 366.3 358.5<br />
finAnciAl AnD opeRAtionAl highlights<br />
Key financial highlights for the year ended 30 June<br />
<strong>2012</strong> included:<br />
— profit attributable to the stapled securityholders of <strong>Mirvac</strong><br />
of $416.1m, an increase of 128.0 per cent, which included<br />
a net gain on investment properties (including IPuC)<br />
of $132.9m, profit of $21.4m from the sale of the hotel<br />
Management business and, as previously announced in<br />
February <strong>2012</strong>, a provision for loss on inventories of $25.0m<br />
in respect to Beachside Leighton, North Fremantle, wA;<br />
— operating profit after tax of $366.3m 1 , representing<br />
10.7 cents per stapled security;<br />
— net tangible assets (“NTA”) per stapled security of<br />
$1.66 from $1.62 2 ;<br />
— operating cash flow of $317.0m; and<br />
— full year distribution of $287.0m, representing 8.40 cents<br />
per stapled security.<br />
Key operational highlights for the year ended 30 June<br />
<strong>2012</strong> included:<br />
— successfully delivered on the <strong>Group</strong>’s strategy to simplify<br />
its business with the sale of the hotel Management<br />
business, realising a profit of $21.4m 3 ;<br />
— established strategic relationships with K-ReIT Asia and<br />
AvIvA Investors via the sale of 50.0 per cent of 8 Chifley<br />
Square, Sydney NSw and hoxton Distribution Park,<br />
hoxton Park NSw respectively;<br />
— achieved 3.4 per cent like-for-like net operating income<br />
growth within the Investment Division’s portfolio;<br />
— maintained a high portfolio occupancy rate of 98.4 per cent 4<br />
and a strong weighted average lease expiry of 7.4 years 4<br />
within the Investment Division’s portfolio;<br />
— leased 147,646 square metres (10.4 per cent of net lettable<br />
area) within the Investment Division’s portfolio;<br />
— disposed of four non-core retail properties within the<br />
Investment Division’s portfolio, realising $132.0m in gross<br />
sale proceeds;<br />
— continued the strong focus on corporate responsibility<br />
and sustainability with the Investment Division’s portfolio<br />
achieving a National Australian Built environment Rating<br />
System (“NABeRS”) office energy rating of 4.3 Star<br />
average, six months ahead of the December <strong>2012</strong> target<br />
of 4.0 Stars, and 8 Chifley Square, Sydney NSw awarded<br />
a 6.0 Star Green Star office Design v2 rating;<br />
— <strong>Mirvac</strong>’s safety performance continued to improve with a<br />
lost time injury frequency rate of 7.3 for employees plus<br />
service providers, representing a 17.0 per cent improvement<br />
over the corresponding period for the year ended 30 June<br />
2011. In addition, the number of workers’ compensation<br />
claims reduced by 20.5 per cent and the average cost per<br />
claim reduced by 34.7 per cent over the corresponding<br />
period for the year ended 30 June 2011; and<br />
— strong levels of exchanged pre-sales contracts at $907.7m 5<br />
in residential projects and achieved 1,807 residential<br />
lot settlements.<br />
1) excludes specific non-cash items, significant items and related taxation.<br />
2) NTA per stapled security based on ordinary securities including employee Incentive Scheme (“eIS”) securities.<br />
3) After costs.<br />
4) By area, excluding assets under development.<br />
5) Total exchanged pre-sales contracts as at 30 June <strong>2012</strong>, adjusted for <strong>Mirvac</strong>’s share of joint ventures, associates and <strong>Mirvac</strong>’s managed funds.


