MIRVAC gRoup AnnuAl RepoRt 2012 - Mirvac - Mirvac Group
MIRVAC gRoup AnnuAl RepoRt 2012 - Mirvac - Mirvac Group
MIRVAC gRoup AnnuAl RepoRt 2012 - Mirvac - Mirvac Group

You also want an ePaper? Increase the reach of your titles
YUMPU automatically turns print PDFs into web optimized ePapers that Google loves.
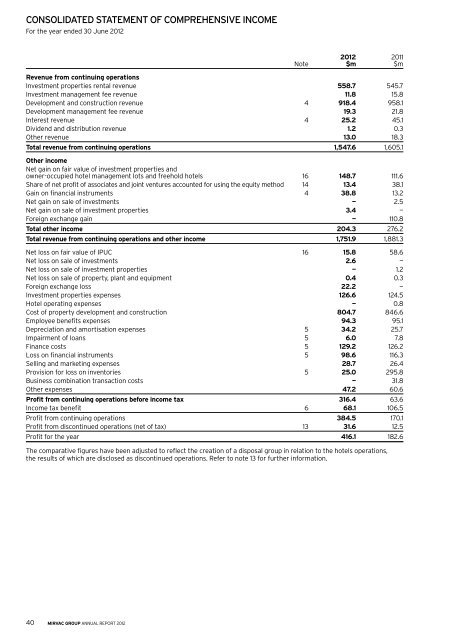
ConsolIDAteD stAteMent of CoMpReHensIVe InCoMe<br />
For the year ended 30 June <strong>2012</strong><br />
40 mirvac group annual report <strong>2012</strong><br />
<strong>2012</strong> 2011<br />
Note $m $m<br />
Revenue from continuing operations<br />
Investment properties rental revenue 558.7 545.7<br />
Investment management fee revenue 11.8 15.8<br />
Development and construction revenue 4 918.4 958.1<br />
Development management fee revenue 19.3 21.8<br />
Interest revenue 4 25.2 45.1<br />
Dividend and distribution revenue 1.2 0.3<br />
other revenue 13.0 18.3<br />
total revenue from continuing operations 1,547.6 1,605.1<br />
other income<br />
Net gain on fair value of investment properties and<br />
owner-occupied hotel management lots and freehold hotels 16 148.7 111.6<br />
Share of net profit of associates and joint ventures accounted for using the equity method 14 13.4 38.1<br />
Gain on financial instruments 4 38.8 13.2<br />
Net gain on sale of investments — 2.5<br />
Net gain on sale of investment properties 3.4 —<br />
Foreign exchange gain — 110.8<br />
total other income 204.3 276.2<br />
total revenue from continuing operations and other income 1,751.9 1,881.3<br />
Net loss on fair value of IPuC 16 15.8 58.6<br />
Net loss on sale of investments 2.6 —<br />
Net loss on sale of investment properties — 1.2<br />
Net loss on sale of property, plant and equipment 0.4 0.3<br />
Foreign exchange loss 22.2 —<br />
Investment properties expenses 126.6 124.5<br />
hotel operating expenses — 0.8<br />
Cost of property development and construction 804.7 846.6<br />
employee benefits expenses 94.3 95.1<br />
Depreciation and amortisation expenses 5 34.2 25.7<br />
Impairment of loans 5 6.0 7.8<br />
Finance costs 5 129.2 126.2<br />
Loss on financial instruments 5 98.6 116.3<br />
Selling and marketing expenses 28.7 26.4<br />
Provision for loss on inventories 5 25.0 295.8<br />
Business combination transaction costs — 31.8<br />
other expenses 47.2 60.6<br />
profit from continuing operations before income tax 316.4 63.6<br />
Income tax benefit 6 68.1 106.5<br />
Profit from continuing operations 384.5 170.1<br />
Profit from discontinued operations (net of tax) 13 31.6 12.5<br />
Profit for the year 416.1 182.6<br />
The comparative figures have been adjusted to reflect the creation of a disposal group in relation to the hotels operations,<br />
the results of which are disclosed as discontinued operations. Refer to note 13 for further information.