CONSOLIDATED STATEMENT OF INCOME - Total.com
CONSOLIDATED STATEMENT OF INCOME - Total.com
CONSOLIDATED STATEMENT OF INCOME - Total.com

You also want an ePaper? Increase the reach of your titles
YUMPU automatically turns print PDFs into web optimized ePapers that Google loves.
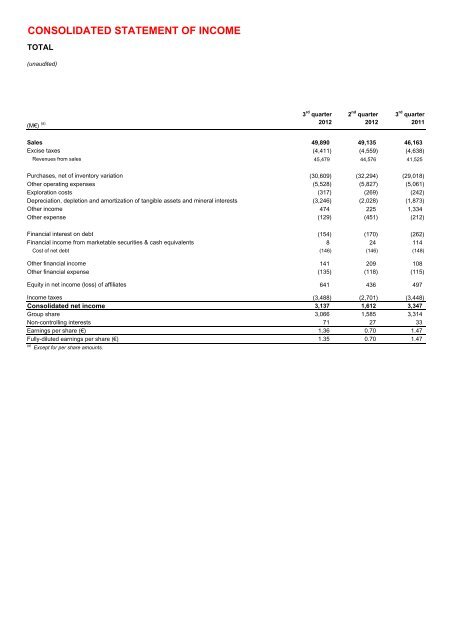
<strong>CONSOLIDATED</strong> <strong>STATEMENT</strong> <strong>OF</strong> <strong>INCOME</strong><br />
TOTAL<br />
(unaudited)<br />
(M€) (a)<br />
3 rd quarter<br />
2012<br />
2 nd quarter<br />
2012<br />
3 rd quarter<br />
2011<br />
Sales 49,890 49,135 46,163<br />
Excise taxes (4,411) (4,559) (4,638)<br />
Revenues from sales 45,479 44,576 41,525<br />
Purchases, net of inventory variation (30,609) (32,294) (29,018)<br />
Other operating expenses (5,528) (5,827) (5,061)<br />
Exploration costs (317) (269) (242)<br />
Depreciation, depletion and amortization of tangible assets and mineral interests (3,246) (2,028) (1,873)<br />
Other in<strong>com</strong>e 474 225 1,334<br />
Other expense (129) (451) (212)<br />
Financial interest on debt (154) (170) (262)<br />
Financial in<strong>com</strong>e from marketable securities & cash equivalents 8 24 114<br />
Cost of net debt (146) (146) (148)<br />
Other financial in<strong>com</strong>e 141 209 108<br />
Other financial expense (135) (118) (115)<br />
Equity in net in<strong>com</strong>e (loss) of affiliates 641 436 497<br />
In<strong>com</strong>e taxes (3,488) (2,701) (3,448)<br />
Consolidated net in<strong>com</strong>e 3,137 1,612 3,347<br />
Group share 3,066 1,585 3,314<br />
Non-controlling interests 71 27 33<br />
Earnings per share (€) 1.36<br />
0.70<br />
1.47<br />
Fully-diluted earnings per share (€) 1.35<br />
0.70<br />
1.47<br />
(a) Except for per share amounts.
<strong>CONSOLIDATED</strong> <strong>STATEMENT</strong> <strong>OF</strong> COMPREHENSIVE <strong>INCOME</strong><br />
TOTAL<br />
(unaudited)<br />
(M€)<br />
3 rd quarter<br />
2012<br />
2 nd quarter<br />
2012<br />
3 rd quarter<br />
2011<br />
Consolidated net in<strong>com</strong>e 3,137 1,612 3,347<br />
Other <strong>com</strong>prehensive in<strong>com</strong>e<br />
Currency translation adjustment (1,007) 2,360 2,309<br />
Available for sale financial assets (183) (93) (389)<br />
Cash flow hedge 33 (67) (54)<br />
Share of other <strong>com</strong>prehensive in<strong>com</strong>e of associates, net amount 86 (57) (131)<br />
Other (2) (7) (2)<br />
Tax effect 37 46 82<br />
<strong>Total</strong> other <strong>com</strong>prehensive in<strong>com</strong>e (net amount) (1,036) 2,182 1,815<br />
Comprehensive in<strong>com</strong>e 2,101 3,794 5,162<br />
- Group share 2,061 3,718 5,077<br />
- Non-controlling interests 40 76 85
<strong>CONSOLIDATED</strong> <strong>STATEMENT</strong> <strong>OF</strong> <strong>INCOME</strong><br />
TOTAL<br />
(unaudited)<br />
(M€) (a)<br />
9 months<br />
2012<br />
9 months<br />
2011<br />
Sales 150,193 137,201<br />
Excise taxes (13,363) (13,609)<br />
Revenues from sales 136,830 123,592<br />
Purchases, net of inventory variation (94,944) (84,659)<br />
Other operating expenses (16,447) (14,567)<br />
Exploration costs (942) (680)<br />
Depreciation, depletion and amortization of tangible assets and mineral interests (7,112) (5,090)<br />
Other in<strong>com</strong>e 988 1,665<br />
Other expense (676) (409)<br />
Financial interest on debt (511) (557)<br />
Financial in<strong>com</strong>e from marketable securities & cash equivalents 67 216<br />
Cost of net debt (444) (341)<br />
Other financial in<strong>com</strong>e 435 518<br />
Other financial expense (389) (327)<br />
Equity in net in<strong>com</strong>e (loss) of affiliates 1,618 1,447<br />
In<strong>com</strong>e taxes (10,494) (10,952)<br />
Consolidated net in<strong>com</strong>e 8,423 10,197<br />
Group share 8,313 9,986<br />
Non-controlling interests 110 211<br />
Earnings per share (€) 3.69<br />
4.45<br />
Fully-diluted earnings per share (€)<br />
(a)<br />
Except for per share amounts.<br />
3.67<br />
4.43
<strong>CONSOLIDATED</strong> <strong>STATEMENT</strong> <strong>OF</strong> COMPREHENSIVE <strong>INCOME</strong><br />
TOTAL<br />
(unaudited)<br />
(M€)<br />
9 months<br />
2012<br />
9 months<br />
2011<br />
Consolidated net in<strong>com</strong>e 8,423 10,197<br />
Other <strong>com</strong>prehensive in<strong>com</strong>e<br />
Currency translation adjustment 299 (335)<br />
Available for sale financial assets (342) 41<br />
Cash flow hedge 36 (89)<br />
Share of other <strong>com</strong>prehensive in<strong>com</strong>e of associates, net amount 191 (234)<br />
Other (15) (4)<br />
Tax effect 72 53<br />
<strong>Total</strong> other <strong>com</strong>prehensive in<strong>com</strong>e (net amount) 241 (568)<br />
Comprehensive in<strong>com</strong>e 8,664 9,629<br />
- Group share 8,562 9,433<br />
- Non-controlling interests 102 196
<strong>CONSOLIDATED</strong> BALANCE SHEET<br />
TOTAL<br />
(M€)<br />
ASSETS<br />
September 30,<br />
2012<br />
(unaudited)<br />
June 30, 2012<br />
(unaudited)<br />
December 31,<br />
2011<br />
September 30,<br />
2011<br />
(unaudited)<br />
Non-current assets<br />
Intangible assets, net 12,964 13,847 12,413 10,280<br />
Property, plant and equipment, net 70,583 69,868 64,457 59,729<br />
Equity affiliates : investments and loans 14,413 13,911 12,995 11,455<br />
Other investments 1,181 2,222 3,674 3,767<br />
Hedging instruments of non-current financial debt 1,796 1,886 1,976 2,012<br />
Other non-current assets 5,215 4,850 4,871 4,248<br />
<strong>Total</strong> non-current assets 106,152 106,584 100,386 91,491<br />
Current assets<br />
Inventories, net 17,266 17,111 18,122 16,024<br />
Accounts receivable, net 20,331 19,768 20,049 18,786<br />
Other current assets 11,377 10,435 10,767 7,938<br />
Current financial assets 1,726 1,723 700 1,172<br />
Cash and cash equivalents 16,833 14,998 14,025 19,942<br />
<strong>Total</strong> current assets 67,533 64,035 63,663 63,862<br />
Assets classified as held for sale - - - 1,630<br />
<strong>Total</strong> assets 173,685 170,619 164,049 156,983<br />
LIABILITIES & SHAREHOLDERS' EQUITY<br />
Shareholders' equity<br />
Common shares 5,915 5,911 5,909 5,909<br />
Paid-in surplus and retained earnings 70,703 69,181 66,506 65,862<br />
Currency translation adjustment (487) 401 (988) (3,091)<br />
Treasury shares (3,342) (3,390) (3,390) (3,390)<br />
<strong>Total</strong> shareholders' equity - Group Share 72,789 72,103 68,037 65,290<br />
Non-controlling interests 1,275 1,256 1,352 1,467<br />
<strong>Total</strong> shareholders' equity 74,064 73,359 69,389 66,757<br />
Non-current liabilities<br />
Deferred in<strong>com</strong>e taxes 13,167 12,380 12,260 10,601<br />
Employee benefits 1,987 2,005 2,232 2,180<br />
Provisions and other non-current liabilities 11,170 11,264 10,909 8,920<br />
Non-current financial debt 24,606 23,260 22,557 22,415<br />
<strong>Total</strong> non-current liabilities 50,930 48,909 47,958 44,116<br />
Current liabilities<br />
Accounts payable 20,869 20,448 22,086 18,753<br />
Other creditors and accrued liabilities 16,942 17,090 14,774 16,361<br />
Current borrowings 10,647 10,642 9,675 10,406<br />
Other current financial liabilities 233 171 167 249<br />
<strong>Total</strong> current liabilities 48,691 48,351 46,702 45,769<br />
Liabilities directly associated with the assets classified as held for sale - - - 341<br />
<strong>Total</strong> liabilities and shareholders' equity 173,685 170,619 164,049 156,983
<strong>CONSOLIDATED</strong> <strong>STATEMENT</strong> <strong>OF</strong> CASH FLOW<br />
TOTAL<br />
(unaudited)<br />
(M€)<br />
CASH FLOW FROM OPERATING ACTIVITIES<br />
3 rd quarter<br />
2012<br />
2 nd quarter<br />
2012<br />
3 rd quarter<br />
2011<br />
Consolidated net in<strong>com</strong>e 3,137 1,612 3,347<br />
Depreciation, depletion and amortization 3,413 2,164 2,062<br />
Non-current liabilities, valuation allowances and deferred taxes 803 (99) 312<br />
Impact of coverage of pension benefit plans - (362) -<br />
(Gains) losses on sales of assets (419) (165) (1,282)<br />
Undistributed affiliates' equity earnings (135) 193 (34)<br />
(Increase) decrease in working capital (1,661) 2,783 1,501<br />
Other changes, net 25 41 58<br />
Cash flow from operating activities 5,163 6,167 5,964<br />
CASH FLOW USED IN INVESTING ACTIVITIES<br />
Intangible assets and property, plant and equipment additions (4,512) (4,128) (3,802)<br />
Acquisitions of subsidiaries, net of cash acquired (74) (4) 170<br />
Investments in equity affiliates and other securities (156) (455) (69)<br />
Increase in non-current loans (674) (377) (220)<br />
<strong>Total</strong> expenditures (5,416) (4,964) (3,921)<br />
Proceeds from disposal of intangible assets and property, plant and equipment 274 95 213<br />
Proceeds from disposal of subsidiaries, net of cash sold 1 - 399<br />
Proceeds from disposal of non-current investments 1,141 739 4,343<br />
Repayment of non-current loans 219 146 127<br />
<strong>Total</strong> divestments 1,635 980 5,082<br />
Cash flow used in investing activities (3,781) (3,984) 1,161<br />
CASH FLOW USED IN FINANCING ACTIVITIES<br />
Issuance (repayment) of shares:<br />
- Parent <strong>com</strong>pany shareholders 1 - 77<br />
- Treasury shares (68) - -<br />
Dividends paid:<br />
- Parent <strong>com</strong>pany shareholders (1,282) (1,284) (1,283)<br />
- Non-controlling interests (2) (96) (35)<br />
Other transactions with non-controlling interests - 1 -<br />
Net issuance (repayment) of non-current debt 2,062 1,409 1,034<br />
Increase (decrease) in current borrowings (98) (693) (2,541)<br />
Increase (decrease) in current financial assets and liabilities (31) (10) 1,999<br />
Cash flow used in financing activities 582 (673) (749)<br />
Net increase (decrease) in cash and cash equivalents 1,964 1,510 6,376<br />
Effect of exchange rates (129) 158 179<br />
Cash and cash equivalents at the beginning of the period 14,998 13,330 13,387<br />
Cash and cash equivalents at the end of the period 16,833 14,998 19,942
<strong>CONSOLIDATED</strong> <strong>STATEMENT</strong> <strong>OF</strong> CASH FLOW<br />
TOTAL<br />
(unaudited)<br />
(M€)<br />
CASH FLOW FROM OPERATING ACTIVITIES<br />
9 months<br />
2012<br />
9 months<br />
2011<br />
Consolidated net in<strong>com</strong>e 8,423 10,197<br />
Depreciation, depletion and amortization 7,680 5,591<br />
Non-current liabilities, valuation allowances and deferred taxes 1,068 1,160<br />
Impact of coverage of pension benefit plans (362) -<br />
(Gains) losses on sales of assets (865) (1,517)<br />
Undistributed affiliates' equity earnings 92 (157)<br />
(Increase) decrease in working capital 448 1,390<br />
Other changes, net 113 78<br />
Cash flow from operating activities 16,597 16,742<br />
CASH FLOW USED IN INVESTING ACTIVITIES<br />
Intangible assets and property, plant and equipment additions (13,867) (12,391)<br />
Acquisitions of subsidiaries, net of cash acquired (199) (809)<br />
Investments in equity affiliates and other securities (809) (3,290)<br />
Increase in non-current loans (1,445) (684)<br />
<strong>Total</strong> expenditures (16,320) (17,174)<br />
Proceeds from disposal of intangible assets and property, plant and equipment 936 839<br />
Proceeds from disposal of subsidiaries, net of cash sold 35 570<br />
Proceeds from disposal of non-current investments 2,734 5,085<br />
Repayment of non-current loans 600 589<br />
<strong>Total</strong> divestments 4,305 7,083<br />
Cash flow used in investing activities (12,015) (10,091)<br />
CASH FLOW USED IN FINANCING ACTIVITIES<br />
Issuance (repayment) of shares:<br />
- Parent <strong>com</strong>pany shareholders 32 481<br />
- Treasury shares (68) -<br />
Dividends paid:<br />
- Parent <strong>com</strong>pany shareholders (3,852) (3,855)<br />
- Non controlling interests (100) (97)<br />
Other transactions with non-controlling interests 1 59<br />
Net issuance (repayment) of non-current debt 5,135 3,940<br />
Increase (decrease) in current borrowings (1,892) (2,253)<br />
Increase (decrease) in current financial assets and liabilities (970) 365<br />
Cash flow used in financing activities (1,714) (1,360)<br />
Net increase (decrease) in cash and cash equivalents 2,868 5,291<br />
Effect of exchange rates (60) 162<br />
Cash and cash equivalents at the beginning of the period 14,025 14,489<br />
Cash and cash equivalents at the end of the period 16,833 19,942
<strong>CONSOLIDATED</strong> <strong>STATEMENT</strong> <strong>OF</strong> CHANGES IN SHAREHOLDERS' EQUITY<br />
TOTAL<br />
(unaudited)<br />
Common shares issued Paid-in<br />
Currency<br />
Treasury shares<br />
surplus and<br />
translation<br />
retained<br />
adjustment<br />
(M€) Number Amount earnings<br />
Number Amount<br />
As of January 1, 2011 2,349,640,931 5,874 60,538 (2,495) (112,487,679) (3,503) 60,414 857 61,271<br />
Net in<strong>com</strong>e of the first nine months - - 9,986 - - - 9,986 211 10,197<br />
Other <strong>com</strong>prehensive In<strong>com</strong>e - - 45 (598) - - (553) (15) (568)<br />
Comprehensive In<strong>com</strong>e - - 10,031 (598) - - 9,433 196 9,629<br />
Dividend - - (5,173) - - - (5,173) (97) (5,270)<br />
Issuance of <strong>com</strong>mon shares 14,112,010 35 446 - - - 481 - 481<br />
Purchase of treasury shares - - - - - - - - -<br />
Sale of treasury shares (1) - - (113) - 2,931,034 113 - - -<br />
Share-based payments - - 124 - - - 124 - 124<br />
Share cancellation - - - - - - - - -<br />
Other operations with non-controlling interests - - - 2 - - 2 57 59<br />
Other items - - 9 - - - 9 454 463<br />
As of September 30, 2011 2,363,752,941 5,909 65,862 (3,091) (109,556,645) (3,390) 65,290 1,467 66,757<br />
Net in<strong>com</strong>e of the fourth quarter - - 2,290 - - - 2,290 94 2,384<br />
Other <strong>com</strong>prehensive In<strong>com</strong>e - - 186 2,002 - - 2,188 59 2,247<br />
Comprehensive In<strong>com</strong>e - - 2,476 2,002 - - 4,478 153 4,631<br />
Dividend - - (1,284) - - - (1,284) (75) (1,359)<br />
Issuance of <strong>com</strong>mon shares 14,372 - - - - - - - -<br />
Purchase of treasury shares - - - - - - - - -<br />
Sale of treasury shares (1) - - - - 2,472 - - - -<br />
Share-based payments - - 37 - - - 37 - 37<br />
Share cancellation - - - - - - - - -<br />
Other operations with non-controlling interests - - (553) 101 - - (452) (180) (632)<br />
Other items - - (32) - - - (32) (13) (45)<br />
As of December 31, 2011 2,363,767,313 5,909 66,506 (988) (109,554,173) (3,390) 68,037 1,352 69,389<br />
Net in<strong>com</strong>e of the first nine months - - 8,313 - - - 8,313 110 8,423<br />
Other <strong>com</strong>prehensive In<strong>com</strong>e - - (246) 495 - - 249 (8) 241<br />
Comprehensive In<strong>com</strong>e - - 8,067 495 - - 8,562 102 8,664<br />
Dividend - - (3,913) - - - (3,913) (100) (4,013)<br />
Issuance of <strong>com</strong>mon shares 2,151,933 6 26 - - - 32 - 32<br />
Purchase of treasury shares - - - - (1,800,000) (68) (68) - (68)<br />
Sale of treasury shares (1) - - (116) - 2,960,542 116 - - -<br />
Share-based payments - - 114 - - - 114 - 114<br />
Share cancellation - - - - - - - - -<br />
Other operations with non-controlling interests - - 13 6 - - 19 (18) 1<br />
Other items - - 6 - - - 6 (61) (55)<br />
As of September 30, 2012 2,365,919,246 5,915 70,703 (487) (108,393,631) (3,342) 72,789 1,275 74,064<br />
(1) Treasury shares related to the restricted stock grants.<br />
Shareholders'<br />
equity Group<br />
Share<br />
Noncontrolling<br />
interests<br />
<strong>Total</strong><br />
shareholders'<br />
equity
BUSINESS SEGMENT INFORMATION<br />
TOTAL<br />
(unaudited)<br />
3 rd quarter 2012<br />
(M€)<br />
Upstream<br />
Refining<br />
Chemicals<br />
Supply<br />
Marketing<br />
Corporate Inter<strong>com</strong>pany <strong>Total</strong><br />
Non-Group sales 5,001 23,260 21,574 55 - 49,890<br />
Intersegment sales 7,455 11,168 154 47 (18,824) -<br />
Excise taxes - (956) (3,455) - - (4,411)<br />
Revenues from sales 12,456 33,472 18,273 102 (18,824) 45,479<br />
Operating expenses (5,279) (31,914) (17,836) (249) 18,824 (36,454)<br />
Depreciation, depletion and amortization of tangible assets and mineral interests (2,779) (321) (136) (10) - (3,246)<br />
Operating in<strong>com</strong>e 4,398 1,237 301 (157) - 5,779<br />
Equity in net in<strong>com</strong>e (loss) of affiliates and other items 642 41 7 302 - 992<br />
Tax on net operating in<strong>com</strong>e (2,961) (348) (81) (119) - (3,509)<br />
Net operating in<strong>com</strong>e 2,079 930 227 26 - 3,262<br />
Net cost of net debt (125)<br />
Non-controlling interests (71)<br />
Net in<strong>com</strong>e 3,066<br />
3 rd quarter 2012 (adjustments) (a)<br />
(M€)<br />
Upstream<br />
Refining<br />
Chemicals<br />
Supply<br />
Marketing<br />
Corporate Inter<strong>com</strong>pany <strong>Total</strong><br />
Non-Group sales (8) - - - - (8)<br />
Intersegment sales - - - - -<br />
Excise taxes - - - - -<br />
Revenues from sales (8) - - - - (8)<br />
Operating expenses 3 593 (42) - - 554<br />
Depreciation, depletion and amortization of tangible assets and mineral interests (1,134) (2) (14) - - (1,150)<br />
Operating in<strong>com</strong>e (b)<br />
(1,139) 591 (56) - - (604)<br />
Equity in net in<strong>com</strong>e (loss) of affiliates and other items - 5 33 293 - 331<br />
Tax on net operating in<strong>com</strong>e 327 (230) 7 (90) - 14<br />
Net operating in<strong>com</strong>e (b)<br />
(812) 366 (16) 203 - (259)<br />
Net cost of net debt -<br />
Non-controlling interests (23)<br />
Net in<strong>com</strong>e (282)<br />
(a) Adjustments include special items, inventory valuation effect and the effect of changes in fair value.<br />
(b) Of which inventory valuation effect<br />
On operating in<strong>com</strong>e - 627 139 -<br />
On net operating in<strong>com</strong>e - 444 94 -<br />
(c) Of which equity share of adjustments related to Sanofi-Aventis - - - -<br />
3 rd quarter 2012 (adjusted)<br />
(M€) (a)<br />
Upstream<br />
Refining<br />
Chemicals<br />
Supply<br />
Marketing<br />
Corporate Inter<strong>com</strong>pany <strong>Total</strong><br />
Non-Group sales 5,009 23,260 21,574 55 - 49,898<br />
Intersegment sales 7,455 11,168 154 47 (18,824) -<br />
Excise taxes - (956) (3,455) - - (4,411)<br />
Revenues from sales 12,464 33,472 18,273 102 (18,824) 45,487<br />
Operating expenses (5,282) (32,507) (17,794) (249) 18,824 (37,008)<br />
Depreciation, depletion and amortization of tangible assets and mineral interests (1,645) (319) (122) (10) - (2,096)<br />
Adjusted operating in<strong>com</strong>e 5,537 646 357 (157) - 6,383<br />
Equity in net in<strong>com</strong>e (loss) of affiliates and other items 642 36 (26) 9 - 661<br />
Tax on net operating in<strong>com</strong>e (3,288) (118) (88) (29) - (3,523)<br />
Adjusted net operating in<strong>com</strong>e 2,891 564 243 (177) - 3,521<br />
Net cost of net debt (125)<br />
Non-controlling interests (48)<br />
Ajusted net in<strong>com</strong>e 3,348<br />
Adjusted fully-diluted earnings per share (€) 1.48<br />
(a) Except for per share amounts.<br />
3 rd quarter 2012<br />
(M€)<br />
Upstream<br />
Refining<br />
Chemicals<br />
Supply<br />
Marketing<br />
Corporate Inter<strong>com</strong>pany <strong>Total</strong><br />
<strong>Total</strong> expenditures 4,567 441 383 25 - 5,416<br />
<strong>Total</strong> divestments 401 55 41 1,138 - 1,635<br />
Cash flow from operating activities 3,457 1,036 692 (22) - 5,163
BUSINESS SEGMENT INFORMATION<br />
TOTAL<br />
(unaudited)<br />
2 nd quarter 2012<br />
(M€)<br />
Upstream<br />
Refining<br />
Chemicals<br />
Supply<br />
Marketing<br />
Corporate Inter<strong>com</strong>pany <strong>Total</strong><br />
Non-Group sales 4,977 22,592 21,519 47 - 49,135<br />
Intersegment sales 7,751 10,474 222 48 (18,495) -<br />
Excise taxes - (874) (3,686) 1 - (4,559)<br />
Revenues from sales 12,728 32,192 18,055 96 (18,495) 44,576<br />
Operating expenses (6,190) (32,646) (17,764) (285) 18,495 (38,390)<br />
Depreciation, depletion and amortization of tangible assets and mineral interests (1,513) (319) (189) (7) - (2,028)<br />
Operating in<strong>com</strong>e 5,025 (773) 102 (196) - 4,158<br />
Equity in net in<strong>com</strong>e (loss) of affiliates and other items 448 23 (14) (156) - 301<br />
Tax on net operating in<strong>com</strong>e (2,911) 256 (62) (14) - (2,731)<br />
Net operating in<strong>com</strong>e 2,562 (494) 26 (366) - 1,728<br />
Net cost of net debt (116)<br />
Non-controlling interests (27)<br />
Net in<strong>com</strong>e 1,585<br />
2 nd quarter 2012 (adjustments) (a)<br />
(M€)<br />
Upstream<br />
Refining<br />
Chemicals<br />
Supply<br />
Marketing<br />
Corporate Inter<strong>com</strong>pany <strong>Total</strong><br />
Non-Group sales 11 - - - - 11<br />
Intersegment sales - - - - -<br />
Excise taxes - - - - -<br />
Revenues from sales 11 - - - - 11<br />
Operating expenses (18) (1,238) (148) (23) - (1,427)<br />
Depreciation, depletion and amortization of tangible assets and mineral interests - - (46) - - (46)<br />
Operating in<strong>com</strong>e (b)<br />
(7) (1,238) (194) (23) - (1,462)<br />
Equity in net in<strong>com</strong>e (loss) of affiliates and other items - (40) (8) (244) - (292)<br />
Tax on net operating in<strong>com</strong>e 9 401 47 (9) - 448<br />
Net operating in<strong>com</strong>e (b)<br />
2 (877) (155) (276) - (1,306)<br />
Net cost of net debt -<br />
Non-controlling interests 33<br />
Net in<strong>com</strong>e (1,273)<br />
(a) Adjustments include special items, inventory valuation effect and the effect of changes in fair value.<br />
(b) Of which inventory valuation effect<br />
On operating in<strong>com</strong>e - (1,238) (146) -<br />
On net operating in<strong>com</strong>e - (877) (99) -<br />
(c) Of which equity share of adjustments related to Sanofi-Aventis - - - -<br />
2 nd quarter 2012 (adjusted)<br />
(M€) (a)<br />
Upstream<br />
Refining<br />
Chemicals<br />
Supply<br />
Marketing<br />
Corporate Inter<strong>com</strong>pany <strong>Total</strong><br />
Non-Group sales 4,966 22,592 21,519 47 - 49,124<br />
Intersegment sales 7,751 10,474 222 48 (18,495) -<br />
Excise taxes - (874) (3,686) 1 - (4,559)<br />
Revenues from sales 12,717 32,192 18,055 96 (18,495) 44,565<br />
Operating expenses (6,172) (31,408) (17,616) (262) 18,495 (36,963)<br />
Depreciation, depletion and amortization of tangible assets and mineral interests (1,513) (319) (143) (7) - (1,982)<br />
Adjusted operating in<strong>com</strong>e 5,032 465 296 (173) - 5,620<br />
Equity in net in<strong>com</strong>e (loss) of affiliates and other items 448 63 (6) 88 - 593<br />
Tax on net operating in<strong>com</strong>e (2,920) (145) (109) (5) - (3,179)<br />
Adjusted net operating in<strong>com</strong>e 2,560 383 181 (90) - 3,034<br />
Net cost of net debt (116)<br />
Non-controlling interests (60)<br />
Ajusted net in<strong>com</strong>e 2,858<br />
Adjusted fully-diluted earnings per share (€) 1.26<br />
(a) Except for per share amounts.<br />
2 nd quarter 2012<br />
(M€)<br />
Upstream<br />
Refining<br />
Chemicals<br />
Supply<br />
Marketing<br />
Corporate Inter<strong>com</strong>pany <strong>Total</strong><br />
<strong>Total</strong> expenditures 4,227 501 212 24 - 4,964<br />
<strong>Total</strong> divestments 234 7 20 719 - 980<br />
Cash flow from operating activities 5,298 625 (140) 384 - 6,167
BUSINESS SEGMENT INFORMATION<br />
TOTAL<br />
(unaudited)<br />
3 rd quarter 2011<br />
(M€)<br />
Upstream<br />
Refining<br />
Chemicals<br />
Supply<br />
Marketing<br />
Corporate Inter<strong>com</strong>pany <strong>Total</strong><br />
Non-Group sales 4,770 19,267 22,124 2 - 46,163<br />
Intersegment sales 6,571 11,190 218 45 (18,024) -<br />
Excise taxes - (502) (4,136) - - (4,638)<br />
Revenues from sales 11,341 29,955 18,206 47 (18,024) 41,525<br />
Operating expenses (4,904) (29,539) (17,766) (136) 18,024 (34,321)<br />
Depreciation, depletion and amortization of tangible assets and mineral interests (1,262) (473) (129) (9) - (1,873)<br />
Operating in<strong>com</strong>e 5,175 (57) 311 (98) - 5,331<br />
Equity in net in<strong>com</strong>e (loss) of affiliates and other items 974 496 118 24 - 1,612<br />
Tax on net operating in<strong>com</strong>e (3,420) 9 (93) 41 - (3,463)<br />
Net operating in<strong>com</strong>e 2,729 448 336 (33) - 3,480<br />
Net cost of net debt (133)<br />
Non-controlling interests (33)<br />
Net in<strong>com</strong>e 3,314<br />
3 rd quarter 2011 (adjustments) (a)<br />
(M€)<br />
Upstream<br />
Refining<br />
Chemicals<br />
Supply<br />
Marketing<br />
Corporate Inter<strong>com</strong>pany <strong>Total</strong><br />
Non-Group sales (14) - - - - (14)<br />
Intersegment sales - - - - - -<br />
Excise taxes - - - - - -<br />
Revenues from sales (14) - - - - (14)<br />
Operating expenses - (191) (1) - - (192)<br />
Depreciation, depletion and amortization of tangible assets and mineral interests (75) (171) - - - (246)<br />
Operating in<strong>com</strong>e (b) (89) (362) (1) - - (452)<br />
Equity in net in<strong>com</strong>e (loss) of affiliates and other items 554 410 148 15 - 1,127<br />
Tax on net operating in<strong>com</strong>e (124) 33 (6) (71) - (168)<br />
Net operating in<strong>com</strong>e (b) 341 81 141 (56) - 507<br />
Net cost of net debt -<br />
Non-controlling interests 6<br />
Net in<strong>com</strong>e 513<br />
(a) Adjustments include special items, inventory valuation effect and the effect of changes in fair value.<br />
(b) Of which inventory valuation effect<br />
On operating in<strong>com</strong>e - (121) 9 -<br />
On net operating in<strong>com</strong>e - (93) 3 -<br />
(c) Of which equity share of adjustments related to Sanofi - - - -<br />
3 rd quarter 2011 (adjusted)<br />
(M€) (a)<br />
Upstream<br />
Refining<br />
Chemicals<br />
Supply<br />
Marketing<br />
Corporate Inter<strong>com</strong>pany <strong>Total</strong><br />
Non-Group sales 4,784 19,267 22,124 2 - 46,177<br />
Intersegment sales 6,571 11,190 218 45 (18,024) -<br />
Excise taxes - (502) (4,136) - - (4,638)<br />
Revenues from sales 11,355 29,955 18,206 47 (18,024) 41,539<br />
Operating expenses (4,904) (29,348) (17,765) (136) 18,024 (34,129)<br />
Depreciation, depletion and amortization of tangible assets and mineral interests (1,187) (302) (129) (9) - (1,627)<br />
Adjusted operating in<strong>com</strong>e 5,264 305 312 (98) - 5,783<br />
Equity in net in<strong>com</strong>e (loss) of affiliates and other items 420 86 (30) 9 - 485<br />
Tax on net operating in<strong>com</strong>e (3,296) (24) (87) 112 - (3,295)<br />
Adjusted net operating in<strong>com</strong>e 2,388 367 195 23 - 2,973<br />
Net cost of net debt (133)<br />
Non-controlling interests (39)<br />
Ajusted net in<strong>com</strong>e 2,801<br />
Adjusted fully-diluted earnings per share (€) 1.24<br />
(a) Except for per share amounts.<br />
3 rd quarter 2011<br />
(M€)<br />
Upstream<br />
Refining<br />
Chemicals<br />
Supply<br />
Marketing<br />
Corporate Inter<strong>com</strong>pany <strong>Total</strong><br />
<strong>Total</strong> expenditures 3,426 423 48 24 - 3,921<br />
<strong>Total</strong> divestments 936 2,422 1,380 344 - 5,082<br />
Cash flow from operating activities 4,042 * 1,557 516 (151) * - 5,964<br />
* Reclassification of inter<strong>com</strong>pany transactions between Upstream and Corporate for €823 million with no impact on the total of cash flow from operating activities
BUSINESS SEGMENT INFORMATION<br />
TOTAL<br />
(unaudited)<br />
9 months 2012<br />
(M€)<br />
Upstream<br />
Refining<br />
Chemicals<br />
Supply<br />
Marketing<br />
Corporate Inter<strong>com</strong>pany <strong>Total</strong><br />
Non-Group sales 16,155 68,948 64,945 145 - 150,193<br />
Intersegment sales 23,440 33,457 607 140 (57,644) -<br />
Excise taxes - (2,634) (10,729) - - (13,363)<br />
Revenues from sales 39,595 99,771 54,823 285 (57,644) 136,830<br />
Operating expenses (18,008) (97,617) (53,588) (764) 57,644 (112,333)<br />
Depreciation, depletion and amortization of tangible assets and mineral interests (5,685) (954) (447) (26) - (7,112)<br />
Operating in<strong>com</strong>e 15,902 1,200 788 (505) - 17,385<br />
Equity in net in<strong>com</strong>e (loss) of affiliates and other items 1,633 156 (76) 263 - 1,976<br />
Tax on net operating in<strong>com</strong>e (9,858) (306) (299) (129) - (10,592)<br />
Net operating in<strong>com</strong>e 7,677 1,050 413 (371) - 8,769<br />
Net cost of net debt (346)<br />
Non-controlling interests (110)<br />
Net in<strong>com</strong>e 8,313<br />
9 months 2012 (adjustments) (a)<br />
(M€)<br />
Upstream<br />
Refining<br />
Chemicals<br />
Supply<br />
Marketing<br />
Corporate Inter<strong>com</strong>pany <strong>Total</strong><br />
Non-Group sales (22) - - - - (22)<br />
Intersegment sales - - - - -<br />
Excise taxes - - - - -<br />
Revenues from sales (22) - - - - (22)<br />
Operating expenses (15) 138 (127) (88) - (92)<br />
Depreciation, depletion and amortization of tangible assets and mineral interests (1,134) (2) (60) - - (1,196)<br />
Operating in<strong>com</strong>e (b)<br />
(1,171) 136 (187) (88) - (1,310)<br />
Equity in net in<strong>com</strong>e (loss) of affiliates and other items - (12) 4 159 - 151<br />
Tax on net operating in<strong>com</strong>e 341 (82) 32 (106) - 185<br />
Net operating in<strong>com</strong>e (b)<br />
(830) 42 (151) (35) - (974)<br />
Net cost of net debt -<br />
Non-controlling interests 7<br />
Net in<strong>com</strong>e (967)<br />
(a) Adjustments include special items, inventory valuation effect and the effect of changes in fair value.<br />
(b) Of which inventory valuation effect<br />
On operating in<strong>com</strong>e - 172 56 -<br />
On net operating in<strong>com</strong>e - 120 35 -<br />
(c) Of which equity share of adjustments related to Sanofi-Aventis - - - -<br />
9 months 2012 (adjusted)<br />
(M€) (a)<br />
Upstream<br />
Refining<br />
Chemicals<br />
Supply<br />
Marketing<br />
Corporate Inter<strong>com</strong>pany <strong>Total</strong><br />
Non-Group sales 16,177 68,948 64,945 145 - 150,215<br />
Intersegment sales 23,440 33,457 607 140 (57,644) -<br />
Excise taxes - (2,634) (10,729) - - (13,363)<br />
Revenues from sales 39,617 99,771 54,823 285 (57,644) 136,852<br />
Operating expenses (17,993) (97,755) (53,461) (676) 57,644 (112,241)<br />
Depreciation, depletion and amortization of tangible assets and mineral interests (4,551) (952) (387) (26) - (5,916)<br />
Adjusted operating in<strong>com</strong>e 17,073 1,064 975 (417) - 18,695<br />
Equity in net in<strong>com</strong>e (loss) of affiliates and other items 1,633 168 (80) 104 - 1,825<br />
Tax on net operating in<strong>com</strong>e (10,199) (224) (331) (23) - (10,777)<br />
Adjusted net operating in<strong>com</strong>e 8,507 1,008 564 (336) - 9,743<br />
Net cost of net debt (346)<br />
Non-controlling interests (117)<br />
Ajusted net in<strong>com</strong>e 9,280<br />
Adjusted fully-diluted earnings per share (€) 4.10<br />
(a) Except for per share amounts.<br />
9 months 2012<br />
(M€)<br />
Upstream<br />
Refining<br />
Chemicals<br />
Supply<br />
Marketing<br />
Corporate Inter<strong>com</strong>pany <strong>Total</strong><br />
<strong>Total</strong> expenditures 14,100 1,371 793 56 - 16,320<br />
<strong>Total</strong> divestments 1,383 203 106 2,613 - 4,305<br />
Cash flow from operating activities 14,521 1,625 108 343 - 16,597
BUSINESS SEGMENT INFORMATION<br />
TOTAL<br />
(unaudited)<br />
9 months 2011<br />
(M€)<br />
Upstream<br />
Refining<br />
Chemicals<br />
Supply<br />
Marketing<br />
Corporate Inter<strong>com</strong>pany <strong>Total</strong><br />
Non-Group sales 16,079 57,741 63,367 14 - 137,201<br />
Intersegment sales 19,851 32,198 615 129 (52,793) -<br />
Excise taxes - (1,483) (12,126) - - (13,609)<br />
Revenues from sales 35,930 88,456 51,856 143 (52,793) 123,592<br />
Operating expenses (15,883) (85,997) (50,369) (450) 52,793 (99,906)<br />
Depreciation, depletion and amortization of tangible assets and mineral interests (3,602) (1,106) (356) (26) - (5,090)<br />
Operating in<strong>com</strong>e 16,445 1,353 1,131 (333) - 18,596<br />
Equity in net in<strong>com</strong>e (loss) of affiliates and other items 1,874 608 118 294 - 2,894<br />
Tax on net operating in<strong>com</strong>e (10,233) (444) (341) (12) - (11,030)<br />
Net operating in<strong>com</strong>e 8,086 1,517 908 (51) - 10,460<br />
Net cost of net debt (263)<br />
Non-controlling interests (211)<br />
Net in<strong>com</strong>e 9,986<br />
9 months 2011 (adjustments) (a)<br />
(M€)<br />
Upstream<br />
Refining<br />
Chemicals<br />
Supply<br />
Marketing<br />
Corporate Inter<strong>com</strong>pany <strong>Total</strong><br />
Non-Group sales 15 - - - - 15<br />
Intersegment sales - - - - - -<br />
Excise taxes - - - - - -<br />
Revenues from sales 15 - - - - 15<br />
Operating expenses - 785 229 - - 1,014<br />
Depreciation, depletion and amortization of tangible assets and mineral interests (75) (171) - - - (246)<br />
Operating in<strong>com</strong>e (b)<br />
(60) 614 229 - - 783<br />
Equity in net in<strong>com</strong>e (loss) of affiliates and other items 722 405 106 69 - 1,302<br />
Tax on net operating in<strong>com</strong>e (326) (315) (78) (73) - (792)<br />
Net operating in<strong>com</strong>e (b)<br />
336 704 257 (4) - 1,293<br />
Net cost of net debt -<br />
Non-controlling interests (6)<br />
Net in<strong>com</strong>e 1,287<br />
(a) Adjustments include special items, inventory valuation effect and the effect of changes in fair value.<br />
(b) Of which inventory valuation effect<br />
On operating in<strong>com</strong>e - 904 253 -<br />
On net operating in<strong>com</strong>e - 629 178 -<br />
(c) Of which equity share of adjustments related to Sanofi - - - -<br />
9 months 2011 (adjusted)<br />
(M€) (a)<br />
Upstream<br />
Refining<br />
Chemicals<br />
Supply<br />
Marketing<br />
Corporate Inter<strong>com</strong>pany <strong>Total</strong><br />
Non-Group sales 16,064 57,741 63,367 14 - 137,186<br />
Intersegment sales 19,851 32,198 615 129 (52,793) -<br />
Excise taxes - (1,483) (12,126) - - (13,609)<br />
Revenues from sales 35,915 88,456 51,856 143 (52,793) 123,577<br />
Operating expenses (15,883) (86,782) (50,598) (450) 52,793 (100,920)<br />
Depreciation, depletion and amortization of tangible assets and mineral interests (3,527) (935) (356) (26) - (4,844)<br />
Adjusted operating in<strong>com</strong>e 16,505 739 902 (333) - 17,813<br />
Equity in net in<strong>com</strong>e (loss) of affiliates and other items 1,152 203 12 225 - 1,592<br />
Tax on net operating in<strong>com</strong>e (9,907) (129) (263) 61 - (10,238)<br />
Adjusted net operating in<strong>com</strong>e 7,750 813 651 (47) - 9,167<br />
Net cost of net debt (263)<br />
Non-controlling interests (205)<br />
Ajusted net in<strong>com</strong>e 8,699<br />
Adjusted fully-diluted earnings per share (€) 3.86<br />
(a) Except for per share amounts.<br />
9 months 2011<br />
(M€)<br />
Upstream<br />
Refining<br />
Chemicals<br />
Supply<br />
Marketing<br />
Corporate Inter<strong>com</strong>pany <strong>Total</strong><br />
<strong>Total</strong> expenditures 14,528 1,286 1,289 71 - 17,174<br />
<strong>Total</strong> divestments 2,192 2,451 1,428 1,012 - 7,083<br />
Cash flow from operating activities 13,497 2,795 407 43 - 16,742<br />
* Reclassification of inter<strong>com</strong>pany transactions between Upstream and Corporate for €823 million with no impact on the total of cash flow from operating activities
ADJUSTMENTS TO OPERATING <strong>INCOME</strong><br />
(M€) Upstream<br />
Refining<br />
Chemicals<br />
Supply<br />
Marketing<br />
Corporate <strong>Total</strong><br />
3 rd quarter 2012 Inventory valuation effect - 627 139 - 766<br />
Effect of changes in fair value (8) - - - (8)<br />
Restructuring charges - (4) (12) - (16)<br />
Asset impairment charges (1,134) - - - (1,134)<br />
Other items 3 (32) (183) - (212)<br />
<strong>Total</strong> (1,139) 591 (56) - (604)<br />
3 rd quarter 2011 Inventory valuation effect - (121) 9 - (112)<br />
Effect of changes in fair value (14) - - - (14)<br />
Restructuring charges - - - - -<br />
Asset impairment charges (75) (170) - - (245)<br />
Other items - (71) (10) - (81)<br />
<strong>Total</strong> (89) (362) (1) - (452)<br />
9 months 2012 Inventory valuation effect - 172 56 - 228<br />
Effect of changes in fair value (22) - - - (22)<br />
Restructuring charges - (4) (60) - (64)<br />
Asset impairment charges (1,134) - - - (1,134)<br />
Other items (15) (32) (183) (88) (318)<br />
<strong>Total</strong> (1,171) 136 (187) (88) (1,310)<br />
9 months 2011 Inventory valuation effect - 904 253 - 1,157<br />
Effect of changes in fair value 15 - - - 15<br />
Restructuring charges - - - - -<br />
Asset impairment charges (75) (170) - - (245)<br />
Other items - (120) (24) - (144)<br />
<strong>Total</strong> (60) 614 229 - 783<br />
ADJUSTMENTS TO NET <strong>INCOME</strong> GROUP SHARE<br />
Consolidated Financial Statements as of september 30, 2012<br />
Nature of the elements of adjustment by business segment<br />
(M€)<br />
(M€) Upstream<br />
Refining<br />
Chemicals<br />
Supply<br />
Marketing<br />
Corporate <strong>Total</strong><br />
3 rd quarter 2012 Inventory valuation effect - 444 80 - 524<br />
Effect of changes in fair value (6) - - - (6)<br />
Restructuring charges - (18) (15) - (33)<br />
Asset impairment charges (737) - - - (737)<br />
Gains (losses) on disposals of assets - - - 202 202<br />
Other items (69) (60) (104) 1 (232)<br />
<strong>Total</strong> (812) 366 (39) 203 (282)<br />
3 rd quarter 2011 Inventory valuation effect - (93) 6 - (87)<br />
Effect of changes in fair value (10) - - - (10)<br />
Restructuring charges - (35) (21) - (56)<br />
Asset impairment charges (75) (169) (7) - (251)<br />
Gains (losses) on disposals of assets 427 418 206 3 1,054<br />
Other items (1) (40) (37) (59) (137)<br />
<strong>Total</strong> 341 81 147 (56) 513<br />
9 months 2012 Inventory valuation effect - 120 35 - 155<br />
Effect of changes in fair value (17) - - - (17)<br />
Restructuring charges - (18) (55) - (73)<br />
Asset impairment charges (737) - (20) (18) (775)<br />
Gains (losses) on disposals of assets - - - 355 355<br />
Other items (76) (60) (104) (372) (612)<br />
<strong>Total</strong> (830) 42 (144) (35) (967)<br />
9 months 2011 Inventory valuation effect - 629 156 - 785<br />
Effect of changes in fair value 12 - - - 12<br />
Restructuring charges - (35) (21) - (56)<br />
Asset impairment charges (75) (169) (54) - (298)<br />
Gains (losses) on disposals of assets 591 418 206 55 1,270<br />
Other items (179) (139) (49) (59) (426)<br />
<strong>Total</strong> 349 704 238 (4) 1,287
Reconciliation of the information by business segment with consolidated financial statements<br />
TOTAL<br />
(unaudited)<br />
3 rd quarter 2012<br />
(M€)<br />
Adjusted Adjustments (a) Consolidated<br />
statement of in<strong>com</strong>e<br />
Sales 49,898 (8) 49,890<br />
Excise taxes (4,411) - (4,411)<br />
Revenues from sales 45,487 (8) 45,479<br />
Purchases net of inventory variation (31,375) 766 (30,609)<br />
Other operating expenses (5,316) (212) (5,528)<br />
Exploration costs (317) - (317)<br />
Depreciation, depletion and amortization of tangible assets and mineral interests (2,096) (1,150) (3,246)<br />
Other in<strong>com</strong>e 142 332 474<br />
Other expense (114) (15) (129)<br />
Financial interest on debt (154) - (154)<br />
Financial in<strong>com</strong>e from marketable securities & cash equivalents 8 - 8<br />
Cost of net debt (146) - (146)<br />
Other financial in<strong>com</strong>e 141 - 141<br />
Other financial expense (135) - (135)<br />
Equity in net in<strong>com</strong>e (loss) of affiliates 627 14 641<br />
In<strong>com</strong>e taxes (3,502) 14 (3,488)<br />
Consolidated net in<strong>com</strong>e 3,396 (259) 3,137<br />
Group share 3,348 (282) 3,066<br />
Non-controlling interests 48 23 71<br />
(a) Adjustments include special items, inventory valuation effect and the effect of changes in fair value.<br />
3 rd quarter 2011<br />
(M€)<br />
Adjusted Adjustments (a) Consolidated<br />
statement of in<strong>com</strong>e<br />
Sales 46,177 (14) 46,163<br />
Excise taxes (4,638) - (4,638)<br />
Revenues from sales 41,539 (14) 41,525<br />
Purchases net of inventory variation (28,906) (112) (29,018)<br />
Other operating expenses (4,981) (80) (5,061)<br />
Exploration costs (242) - (242)<br />
Depreciation, depletion and amortization of tangible assets and mineral interests (1,627) (246) (1,873)<br />
Other in<strong>com</strong>e 69 1,265 1,334<br />
Other expense (95) (117) (212)<br />
Financial interest on debt (262) - (262)<br />
Financial in<strong>com</strong>e from marketable securities & cash equivalents 114 - 114<br />
Cost of net debt (148) - (148)<br />
Other financial in<strong>com</strong>e 108 - 108<br />
Other financial expense (115) - (115)<br />
Equity in net in<strong>com</strong>e (loss) of affiliates 518 (21) 497<br />
In<strong>com</strong>e taxes (3,280) (168) (3,448)<br />
Consolidated net in<strong>com</strong>e 2,840 507 3,347<br />
Group share 2,801 513 3,314<br />
Non-controlling interests 39 (6) 33<br />
(a) Adjustments include special items, inventory valuation effect and the effect of changes in fair value.
Reconciliation of the information by business segment with consolidated financial statements<br />
TOTAL<br />
(unaudited)<br />
9 months 2012<br />
(M€)<br />
Adjusted Adjustments (a) Consolidated<br />
statement of in<strong>com</strong>e<br />
Sales 150,215 (22) 150,193<br />
Excise taxes (13,363) - (13,363)<br />
Revenues from sales 136,852 (22) 136,830<br />
Purchases net of inventory variation (95,172) 228 (94,944)<br />
Other operating expenses (16,127) (320) (16,447)<br />
Exploration costs (942) - (942)<br />
Depreciation, depletion and amortization of tangible assets and mineral interests (5,916) (1,196) (7,112)<br />
Other in<strong>com</strong>e 447 541 988<br />
Other expense (314) (362) (676)<br />
Financial interest on debt (511) - (511)<br />
Financial in<strong>com</strong>e from marketable securities & cash equivalents 67 - 67<br />
Cost of net debt (444) - (444)<br />
Other financial in<strong>com</strong>e 435 - 435<br />
Other financial expense (389) - (389)<br />
Equity in net in<strong>com</strong>e (loss) of affiliates 1,646 (28) 1,618<br />
In<strong>com</strong>e taxes (10,679) 185 (10,494)<br />
Consolidated net in<strong>com</strong>e 9,397 (974) 8,423<br />
Group share 9,280 (967) 8,313<br />
Non-controlling interests 117 (7) 110<br />
(a) Adjustments include special items, inventory valuation effect and the effect of changes in fair value.<br />
9 months 2011<br />
(M€)<br />
Adjusted Adjustments (a) Consolidated<br />
statement of in<strong>com</strong>e<br />
Sales 137,186 15 137,201<br />
Excise taxes (13,609) - (13,609)<br />
Revenues from sales 123,577 15 123,592<br />
Purchases net of inventory variation (85,816) 1,157 (84,659)<br />
Other operating expenses (14,424) (143) (14,567)<br />
Exploration costs (680) - (680)<br />
Depreciation, depletion and amortization of tangible assets and mineral interests (4,844) (246) (5,090)<br />
Other in<strong>com</strong>e 178 1,487 1,665<br />
Other expense (224) (185) (409)<br />
Financial interest on debt (557) - (557)<br />
Financial in<strong>com</strong>e from marketable securities & cash equivalents 216 - 216<br />
Cost of net debt (341) - (341)<br />
Other financial in<strong>com</strong>e 518 - 518<br />
Other financial expense (327) - (327)<br />
Equity in net in<strong>com</strong>e (loss) of affiliates 1,447 - 1,447<br />
In<strong>com</strong>e taxes (10,160) (792) (10,952)<br />
Consolidated net in<strong>com</strong>e 8,904 1,293 10,197<br />
Group share 8,699 1,287 9,986<br />
Non-controlling interests 205 6 211<br />
(a) Adjustments include special items, inventory valuation effect and the effect of changes in fair value.
TOTAL<br />
NOTES TO THE <strong>CONSOLIDATED</strong> FINANCIAL <strong>STATEMENT</strong>S<br />
1) Accounting policies<br />
FOR THE FIRST NINE MONTHS <strong>OF</strong> 2012<br />
(unaudited)<br />
The interim consolidated financial statements of TOTAL S.A. and its subsidiaries (the Group) as of September<br />
30, 2012 are presented in Euros and have been prepared in accordance with International Accounting Standard<br />
(IAS) 34 “Interim Financial Reporting”. The accounting policies applied for the consolidated financial statements as<br />
of September 30, 2012 do not differ significantly from those applied for the consolidated financial statements as of<br />
December 31, 2011 which have been prepared on the basis of IFRS (International Financial Reporting Standards)<br />
as adopted by the European Union and IFRS as issued by the IASB (International Accounting Standard Board).<br />
The preparation of financial statements in accordance with IFRS requires the management to make estimates and<br />
assumptions that affect the reported amounts of assets, liabilities and contingent liabilities at the date of preparation<br />
of the financial statements and reported in<strong>com</strong>e and expenses for the period. The management reviews these<br />
estimates and assumptions on an ongoing basis, by reference to past experience and various other factors<br />
considered as reasonable which form the basis for assessing the carrying amount of assets and liabilities. Actual<br />
results may differ significantly from these estimates, if different assumptions or circumstances apply. These<br />
judgments and estimates relate principally to the application of the successful efforts method for the oil and gas<br />
accounting, the valuation of long-lived assets, the provisions for asset retirement obligations and environmental<br />
remediation, the pensions and post-retirement benefits and the in<strong>com</strong>e tax <strong>com</strong>putation. These estimates and<br />
assumptions are described in the Notes to the consolidated financial statements as of December 31, 2011.<br />
Furthermore, when the accounting treatment of a specific transaction is not addressed by any accounting standard<br />
or interpretation, the management applies its judgment to define and apply accounting policies that will lead to<br />
relevant and reliable information, so that the financial statements:<br />
• give a true and fair view of the Group’s financial position, financial performance and cash flows;<br />
• reflect the substance of transactions;<br />
• are neutral;<br />
• are prepared on a prudent basis; and<br />
• are <strong>com</strong>plete in all material aspects.<br />
Pursuant to the accrual basis of accounting followed by the Group, the financial statements reflect the effects of<br />
transactions and other events when they occur. Assets and liabilities such as property, plant and equipment and<br />
intangible assets are usually measured at amortized cost. Financial assets and liabilities are usually measured at fair<br />
value.<br />
2) Changes in the Group structure, main acquisitions and divestments<br />
Upstream<br />
• TOTAL finalized in February 2012 the acquisition in Uganda of a one-third interest in Blocks 1, 2 and 3A<br />
held by Tullow Oil plc for €1,159 million ($1,484 million), entirely consisting of mineral interests. TOTAL<br />
has be<strong>com</strong>e an equal partner with Tullow and CNOOC in the blocks, each with a one-third interest and<br />
each being an operator of one of the blocks. TOTAL is the operator of Block 1.<br />
• TOTAL finalized during the first half 2012 the acquisition of an additional 1.07% interest in Novatek for an<br />
amount of €324 million ($423 million), increasing TOTAL’s overall interest in Novatek to 15.16%.<br />
Holding<br />
• During the first nine months of the financial year 2012, TOTAL gradually sold its remaining interest in<br />
Sanofi, generating a net capital gain of €355 million after tax. As at the 30 th September 2012 the Group<br />
retains no further interest in the capital of Sanofi.<br />
Annexe EV - 201209 Conseil d'Administration.docxConseil d’Administration Page 1 11/2/2012
3) Adjustment items<br />
Financial information by business segment is reported in accordance with the internal reporting system and shows<br />
internal segment information that is used to manage and measure the performance of TOTAL.<br />
Until June 30, 2012, the Group's activities were conducted through three business segments as follows:<br />
• the Upstream segment including the activities of the Exploration & Production, and the Gas & New Energies<br />
division;<br />
• a Refining-Chemicals segment that is a major industrial hub <strong>com</strong>bining the activities of refining,<br />
petrochemicals, fertilizers and speciality chemicals operations. This segment also includes Trading & Shipping<br />
activities ;<br />
• a Supply & Marketing segment that is dedicated to the global supply and marketing of petroleum products .<br />
In November 2011, the Group launched a review of the Gas & New Energies division. Subsequent to information<br />
and consultation process with employee representatives this reorganization has be<strong>com</strong>e effective as of July 1 st ,<br />
2012 and the Group's activities are now conducted through three business segments as follows:<br />
• an Upstream segment including the activities of the Exploration & Production division and the Gas & Power<br />
division;<br />
• a Refining & Chemicals segment that is a major production hub <strong>com</strong>bining TOTAL’s refining, petrochemicals,<br />
fertilizers and specialty chemicals operations. This segment also includes Trading & Shipping activities;<br />
• a Supply & Marketing segment <strong>com</strong>prising the global supply and marketing of petroleum products and the<br />
New Energies division.<br />
Furthermore, the Corporate segment includes the operating and financial activities of the holding <strong>com</strong>panies.<br />
As a result, information by business segment for <strong>com</strong>parative periods has been restated under the new organization<br />
effective as from July 1, 2012.<br />
Performance indicators excluding the adjustment items, such as adjusted operating in<strong>com</strong>e, adjusted net operating<br />
in<strong>com</strong>e, and adjusted net in<strong>com</strong>e are meant to facilitate the analysis of the financial performance and the<br />
<strong>com</strong>parison of in<strong>com</strong>e between periods.<br />
Adjustment items include:<br />
(i) Special items<br />
Due to their unusual nature or particular significance, certain transactions qualified as "special items" are<br />
excluded from the business segment figures. In general, special items relate to transactions that are<br />
significant, infrequent or unusual. However, in certain instances, transactions such as restructuring costs or<br />
asset disposals, which are not considered to be representative of the normal course of business, may be<br />
qualified as special items although they may have occurred within prior years or are likely to occur again within<br />
the <strong>com</strong>ing years.<br />
(ii) Inventory valuation effect<br />
The adjusted results of the Refining & Chemicals and Supply & Marketing segments are presented according<br />
to the replacement cost method. This method is used to assess the segments’ performance and facilitate the<br />
<strong>com</strong>parability of the segments’ performance with those of its <strong>com</strong>petitors.<br />
In the replacement cost method, which approximates the LIFO (Last-In, First-Out) method, the variation of<br />
inventory values in the statement of in<strong>com</strong>e is, depending on the nature of the inventory, determined using<br />
either the month-end prices differential between one period and another or the average prices of the period<br />
rather than the historical value. The inventory valuation effect is the difference between the results according<br />
to the FIFO (First-In, First-Out) and the replacement cost.<br />
(iii) Effect of changes in fair value<br />
The effect of changes in fair value presented as adjustment item reflects for some transactions differences<br />
between internal measure of performance used by TOTAL’s management and the accounting for these<br />
transactions under IFRS.<br />
IFRS requires that trading inventories be recorded at their fair value using period-end spot prices. In order to<br />
best reflect the management of economic exposure through derivative transactions, internal indicators used to<br />
measure performance include valuations of trading inventories based on forward prices.<br />
Furthermore, TOTAL, in its trading activities, enters into storage contracts, which future effects are recorded at<br />
fair value in Group’s internal economic performance. IFRS precludes recognition of this fair value effect.<br />
Annexe EV - 201209 Conseil d'Administration.docx Page 2 11/2/2012
The adjusted results (adjusted operating in<strong>com</strong>e, adjusted net operating in<strong>com</strong>e, adjusted net in<strong>com</strong>e) are defined<br />
as replacement cost results, adjusted for special items and the effect of changes in fair value.<br />
The detail of the adjustment items is presented in the table below.<br />
ADJUSTMENTS TO OPERATING <strong>INCOME</strong><br />
(M€) Upstream<br />
Refining<br />
Chemicals<br />
Supply<br />
Marketing<br />
Corporate <strong>Total</strong><br />
3 rd quarter 2012 Inventory valuation effect - 627 139 - 766<br />
Effect of changes in fair value (8) - - - (8)<br />
Restructuring charges - (4) (12) - (16)<br />
Asset impairment charges (1,134) - - - (1,134)<br />
Other items 3 (32) (183) - (212)<br />
<strong>Total</strong> (1,139) 591 (56) - (604)<br />
3 rd quarter 2011 Inventory valuation effect - (121) 9 - (112)<br />
Effect of changes in fair value (14) - - - (14)<br />
Restructuring charges - - - - -<br />
Asset impairment charges (75) (170) - - (245)<br />
Other items - (71) (10) - (81)<br />
<strong>Total</strong> (89) (362) (1) - (452)<br />
9 months 2012 Inventory valuation effect - 172 56 - 228<br />
Effect of changes in fair value (22) - - - (22)<br />
Restructuring charges - (4) (60) - (64)<br />
Asset impairment charges (1,134) - - - (1,134)<br />
Other items (15) (32) (183) (88) (318)<br />
<strong>Total</strong> (1,171) 136 (187) (88) (1,310)<br />
9 months 2011 Inventory valuation effect - 904 253 - 1,157<br />
Effect of changes in fair value 15 - - - 15<br />
Restructuring charges - - - - -<br />
Asset impairment charges (75) (170) - - (245)<br />
Other items - (120) (24) - (144)<br />
<strong>Total</strong> (60) 614 229 - 783<br />
ADJUSTMENTS TO NET <strong>INCOME</strong> GROUP SHARE<br />
(M€) Upstream<br />
Refining<br />
Chemicals<br />
Supply<br />
Marketing<br />
Corporate <strong>Total</strong><br />
3 rd quarter 2012 Inventory valuation effect - 444 80 - 524<br />
Effect of changes in fair value (6) - - - (6)<br />
Restructuring charges - (18) (15) - (33)<br />
Asset impairment charges (737) - - - (737)<br />
Gains (losses) on disposals of assets - - - 202 202<br />
Other items (69) (60) (104) 1 (232)<br />
<strong>Total</strong> (812) 366 (39) 203 (282)<br />
3 rd quarter 2011 Inventory valuation effect - (93) 6 - (87)<br />
Effect of changes in fair value (10) - - - (10)<br />
Restructuring charges - (35) (21) - (56)<br />
Asset impairment charges (75) (169) (7) - (251)<br />
Gains (losses) on disposals of assets 427 418 206 3 1,054<br />
Other items (1) (40) (37) (59) (137)<br />
<strong>Total</strong> 341 81 147 (56) 513<br />
9 months 2012 Inventory valuation effect - 120 35 - 155<br />
Effect of changes in fair value (17) - - - (17)<br />
Restructuring charges - (18) (55) - (73)<br />
Asset impairment charges (737) - (20) (18) (775)<br />
Gains (losses) on disposals of assets - - - 355 355<br />
Other items (76) (60) (104) (372) (612)<br />
<strong>Total</strong> (830) 42 (144) (35) (967)<br />
9 months 2011 Inventory valuation effect - 629 156 - 785<br />
Effect of changes in fair value 12 - - - 12<br />
Restructuring charges - (35) (21) - (56)<br />
Asset impairment charges (75) (169) (54) - (298)<br />
Gains (losses) on disposals of assets 591 418 206 55 1,270<br />
Other items (179) (139) (49) (59) (426)<br />
<strong>Total</strong> 349 704 238 (4) 1,287<br />
Annexe EV - 201209 Conseil d'Administration.docx Page 3 11/2/2012
On September 30th, 2012, due to the continuing weakness of US market prices for gas (Henry Hub), the Group<br />
reviewed the value of its shale gas assets in the basin of the Barnett in the US and impaired €1,134 million ($1,453<br />
million) before tax (€737 million after tax).<br />
For the first nine months of 2012, the section “Other elements” contains the impact in deferred taxes, for the amount<br />
of €(70) million, for the change in tax treatment of site restoration costs in the United Kingdom, the House of<br />
Commons having voted for a reduction in the rate of deductibility of site restoration costs as part of the 2012 Finance<br />
Bill, promulgated on the 3 rd July 2012.<br />
This column also contains the impact on the Group net in<strong>com</strong>e, for the amount of €(191) million, of the exceptional<br />
tax of 4% of the value of oil inventory established by the corrective finance law for 2012 (“projet de loi de finances<br />
rectificative pour 2012”). This exceptional contribution is payable by any person, except the French State, that owns<br />
volumes of certain types of petroleum products located in the territory of metropolitan France.<br />
4) Shareholders’ equity<br />
Treasury shares (TOTAL shares held by TOTAL S.A.)<br />
As of Septembre 30, 2012, TOTAL S.A. held 8,062,363 of its own shares, representing 0.34% of its share capital,<br />
detailed as follows:<br />
• 8,053,549 shares allocated to TOTAL restricted shares plans for Group employees; and<br />
• 8,814 shares intended to be allocated to new TOTAL share purchase option plans or to new restricted<br />
shares plans.<br />
These 8,062,363 shares are deducted from the consolidated shareholders’ equity.<br />
Treasury shares (TOTAL shares held by Group subsidiaries)<br />
As of Septembre 30, 2012, TOTAL S.A. held indirectly through its subsidiaries 100,331,268 of its own shares,<br />
representing 4.24% of its share capital, detailed as follows:<br />
• 2,023,672 shares held by a consolidated subsidiary, <strong>Total</strong> Nucléaire, 100% indirectly controlled by<br />
TOTAL S.A.;<br />
• 98,307,596 shares held by subsidiaries of Elf Aquitaine (Financière Valorgest, Sogapar and Fingestval),<br />
100% indirectly controlled by TOTAL S.A.<br />
These 100,331,268 shares are deducted from the consolidated shareholders’ equity.<br />
Dividend<br />
The shareholders’ meeting on May 11, 2012 approved the payment of a cash dividend of €2.28 per share for the<br />
2011 fiscal year. Taking into account three quarterly interim dividends of €0.57 per share that have already been<br />
paid on September 22, 2011, December 22, 2011 and March 22, 2012, the remaining balance of €0.57 per share<br />
was paid on June 21, 2012.<br />
A first quarterly dividend for the fiscal year 2012 of €0.57 per share, decided by the Board of Directors on April 26,<br />
2012, was paid on September 27, 2012.<br />
A second quarterly dividend for the fiscal year 2012 of €0.59 per share, decided by the Board of Directors on July<br />
26, 2012, will be paid on December 20, 2012 (the ex-dividend date will be December 17, 2012).<br />
A third quarterly dividend for the fiscal year 2012 of €[0.59] per share, decided by the Board of Directors on October<br />
30, 2012, will be paid on March 21, 2013 (the ex-dividend date will be March 18, 2013).<br />
Finally, an additional tax to corporate in<strong>com</strong>e tax of 3 %, due on dividends distributed by French <strong>com</strong>panies or<br />
foreign organizations subject to in<strong>com</strong>e tax in France, was established by the corrective finance act for 2012. This<br />
new tax is liable on amounts distributed, the payment of which was due from August 17th, 2012, the effective date of<br />
the law.<br />
In relation to the 1 st and 2 nd<br />
quarter distributions, the impact of this additional tax for the Group is a charge of €80<br />
million. This additional tax is not tax deductible.<br />
Annexe EV - 201209 Conseil d'Administration.docx Page 4 11/2/2012
Other <strong>com</strong>prehensive in<strong>com</strong>e<br />
Detail of other <strong>com</strong>prehensive in<strong>com</strong>e showing items reclassified from equity to net in<strong>com</strong>e is presented in the table<br />
below:<br />
(M€)<br />
9 months 2012<br />
Currency translation adjustment 299 (335)<br />
- unrealized gain/(loss) of the period 296 (318)<br />
- less gain/(loss) included in net in<strong>com</strong>e (3) 17<br />
Available for sale financial assets (342) 41<br />
- unrealized gain/(loss) of the period 69 79<br />
- less gain/(loss) included in net in<strong>com</strong>e 411 38<br />
Cash flow hedge 36 (89)<br />
- unrealized gain/(loss) of the period 87 (75)<br />
- less gain/(loss) included in net in<strong>com</strong>e 51 14<br />
Share of other <strong>com</strong>prehensive in<strong>com</strong>e of<br />
equity affiliates, net amount 191 (234)<br />
Other (15) (4)<br />
- unrealized gain/(loss) of the period (15) (4)<br />
- less gain/(loss) included in net in<strong>com</strong>e - -<br />
Tax effect 72 53<br />
<strong>Total</strong> other <strong>com</strong>prehensive in<strong>com</strong>e, net amount 241 (568)<br />
Tax effects relating to each <strong>com</strong>ponent of other <strong>com</strong>prehensive in<strong>com</strong>e are as follows:<br />
(M€)<br />
Pre-tax<br />
amount Tax effect Net amount<br />
9 months 2011<br />
9 months 2012 9 months 2011<br />
Pre-tax<br />
amount Tax effect Net amount<br />
Currency translation adjustment 299 299 (335) (335)<br />
Available for sale financial assets (342) 88 (254) 41 22 63<br />
Cash flow hedge 36 (16) 20 (89) 31 (58)<br />
Share of other <strong>com</strong>prehensive in<strong>com</strong>e of<br />
equity affiliates, net amount 191 191 (234) (234)<br />
Other (15) (15) (4) (4)<br />
<strong>Total</strong> other <strong>com</strong>prehensive in<strong>com</strong>e 169 72 241 (621) 53 (568)<br />
Annexe EV - 201209 Conseil d'Administration.docx Page 5 11/2/2012
5) Financial debt<br />
The Group issued bonds through its subsidiary <strong>Total</strong> Capital International during the first nine months of 2012:<br />
− Bond 4.875% 2012-2017 (100 million AUD)<br />
− Bond 1.500% 2012-2017 (1,000 million USD)<br />
− Bond 2.875% 2012-2022 (1,000 million USD)<br />
− Bond 4.125% 2012-2017 (150 million AUD)<br />
− Bond 1.550% 2012-2017 (1,500 million USD)<br />
− Bond 2,250% 2012-2016 (600 million NOK)<br />
− Bond 2,250% 2012-2017 (850 million NOK)<br />
− Bond 2.125% 2012-2023 (500 million EUR)<br />
− Bond 0.750% 2012-2016 (500 million USD)<br />
− Bond 2.700% 2012-2023 (1,000 million USD)<br />
The Group reimbursed bonds during the first nine months of 2012:<br />
− Bond 2.125% 2005-2012 (500 million CHF)<br />
− Bond 3.250% 2005-2012 (650 million EUR)<br />
− Bond 5.890% 2002-2012 (20 million USD)<br />
− Bond 4.125% 2006-2012 (200 million CAD)<br />
− Bond 5.625% 2006-2012 (100 million AUD)<br />
− Bond 4.625% 2005-2012 (450 million GBP)<br />
− Bond 5.000% 2007-2012 (900 million USD)<br />
− Bond 6.500% 2007-2012 (100 million AUD)<br />
− Bond 6.000% 2008-2012 (500 million NOK)<br />
− Bond 6.500% 2005-2012 (100 million NZD)<br />
− Bond 5.750% 2005-2012 (100 million AUD)<br />
− Bond 3.625% 2008-2012 (200 million CHF)<br />
In the context of its active cash management, the Group may temporarily increase its current borrowings, particularly<br />
in the form of <strong>com</strong>mercial paper. The changes in current borrowings, cash and cash equivalents and current<br />
financial assets resulting from this cash management in the quarterly financial statements are not necessarily<br />
representative of a longer-term position.<br />
6) Related parties<br />
The related parties are principally equity affiliates and non-consolidated investments. There were no major changes<br />
concerning transactions with related parties during the first nine months of 2012.<br />
Annexe EV - 201209 Conseil d'Administration.docx Page 6 11/2/2012
7) Other risks and contingent liabilities<br />
TOTAL is not currently aware of any exceptional event, dispute, risks or contingent liabilities that could have a<br />
material impact on the assets and liabilities, results, financial position or operations of the Group.<br />
Antitrust investigations<br />
The principal antitrust proceedings in which the Group’s <strong>com</strong>panies are involved are described thereafter.<br />
Refining & Chemicals<br />
• As part of the spin-off of Arkema 1<br />
in 2006, TOTAL S.A. or certain other Group <strong>com</strong>panies agreed to grant<br />
Arkema a guarantee for potential monetary consequences related to antitrust proceedings arising from<br />
events prior to the spin-off.<br />
This guarantee covers, for a period of ten years from the date of the spin-off, 90% of amounts paid by<br />
Arkema related to (i) fines imposed by European authorities or European member-states for <strong>com</strong>petition law<br />
violations, (ii) fines imposed by U.S. courts or antitrust authorities for federal antitrust violations or violations<br />
of the <strong>com</strong>petition laws of U.S. states, (iii) damages awarded in civil proceedings related to the government<br />
proceedings mentioned above, and (iv) certain costs related to these proceedings. The guarantee related to<br />
anti-<strong>com</strong>petition violations in Europe applies to amounts above a €176.5 million threshold. On the other<br />
hand, the agreements provide that Arkema will indemnify TOTAL S.A. or any Group <strong>com</strong>pany for 10% of any<br />
amount that TOTAL S.A. or any Group <strong>com</strong>pany are required to pay under any of the proceedings covered<br />
by this guarantee, in Europe.<br />
If one or more individuals or legal entities, acting alone or together, directly or indirectly holds more than<br />
one-third of the voting rights of Arkema, or if Arkema transfers more than 50% of its assets (as calculated<br />
under the enterprise valuation method, as of the date of the transfer) to a third party or parties acting<br />
together, irrespective of the type or number of transfers, this guarantee will be<strong>com</strong>e void.<br />
• In the United States, civil liability lawsuits, for which TOTAL S.A. has been named as the parent <strong>com</strong>pany,<br />
have been closed without significant impact on the Group’s financial position.<br />
• In Europe, since 2006, the European Commission has fined <strong>com</strong>panies of the Group in its configuration prior<br />
to the spin-off an overall amount of €385.47 million, of which Elf Aquitaine and/or TOTAL S.A. were held<br />
jointly liable for €280.17 million, Elf Aquitaine being personally fined €23.6 million for deterrence. These fines<br />
are entirely settled as of today.<br />
As a result, since the spin-off, the Group has paid the overall amount of €188.07 million 2<br />
, corresponding to<br />
90% of the fines overall amount once the threshold provided for by the guarantee is deducted to which an<br />
amount of €31.31 million of interest has been added as explained hereinafter.<br />
The European Commission imposed these fines following investigations between 2000 and 2004 into<br />
<strong>com</strong>mercial practices involving eight products sold by Arkema. Five of these investigations resulted in<br />
prosecutions from the European Commission for which Elf Aquitaine has been named as the parent<br />
<strong>com</strong>pany, and two of these investigations named TOTAL S.A. as the ultimate parent <strong>com</strong>pany of the Group.<br />
TOTAL S.A. and Elf Aquitaine have contested their liability based solely on their status as parent <strong>com</strong>panies<br />
and appealed for cancellation and reformation of the rulings, some of them were rejected.<br />
By the end of the 2012 third quarter, four of these proceedings are definitively closed for TOTAL S.A. and Elf<br />
Aquitaine as well as for Arkema, one remains pendant before the relevant EU court.<br />
With the exception of the €31.31 million of interest paid in 2011 in accordance with one of the decisions<br />
referred hereinabove, the evolution of the proceedings during the three 2012 first quarters did not modify the<br />
global amount assumed by the Group in execution of the guarantee.<br />
In addition, civil proceedings against Arkema and other groups of <strong>com</strong>panies were initiated in 2009 and<br />
2011, respectively, before the German and Dutch courts by third parties for alleged damages pursuant to<br />
two of the above mentioned legal proceedings. TOTAL S.A. was summoned to serve notice of the dispute<br />
before the German court. At this point, the probability of a favorable verdict and the financial impacts of<br />
these proceedings are uncertain due to the number of legal difficulties they give rise to, the lack of<br />
documented claims and evaluations of the alleged damages.<br />
1 Arkema is used in this section to designate those <strong>com</strong>panies of the Arkema group whose ultimate parent <strong>com</strong>pany is Arkema S.A. Arkema<br />
became an independent <strong>com</strong>pany after being spun-off from TOTAL S.A. in May 2006.<br />
2<br />
This amount does not take into account a case that led to Arkema, prior to Arkema’s spin-off from TOTAL, and Elf Aquitaine being fined jointly<br />
€45 million and Arkema being fined €13.5 million.<br />
Annexe EV - 201209 Conseil d'Administration.docx Page 7 11/2/2012
Arkema began implementing <strong>com</strong>pliance procedures in 2001 that are designed to prevent its employees<br />
from violating antitrust provisions. However, it is not possible to exclude the possibility that the relevant<br />
authorities could <strong>com</strong>mence additional proceedings involving Arkema regarding events prior to the spin-off,<br />
as well as Elf Aquitaine and/or TOTAL S.A. based on their status as parent <strong>com</strong>pany before the spin-off.<br />
Within the framework of all of the legal proceedings described above, a €17 million reserve remains booked in the<br />
Group’s consolidated financial statements as of September 30, 2012.<br />
Supply & Marketing<br />
• Pursuant to a statement of objections received by <strong>Total</strong> Nederland N.V. and TOTAL S.A. (based on its<br />
status as parent <strong>com</strong>pany) from the European Commission, <strong>Total</strong> Nederland N.V. was fined €20.25 million in<br />
2006, for which TOTAL S.A. was held jointly liable for €13.5 million. TOTAL S.A. lodged an appeal against<br />
this decision that was dismissed end of September 2012.<br />
• In addition, pursuant to a statement of objections received by <strong>Total</strong> Raffinage Marketing (formerly <strong>Total</strong><br />
France) and TOTAL S.A. from the European Commission regarding a product line of the Supply & Marketing<br />
segment, <strong>Total</strong> Raffinage Marketing was fined €128.2 million in 2008, which has been paid, and for which<br />
TOTAL S.A. was held jointly liable based on its status as parent <strong>com</strong>pany. The appeal against this decision<br />
is still pending before the relevant European court.<br />
• In addition, civil proceedings against TOTAL S.A and <strong>Total</strong> Raffinage Marketing and other <strong>com</strong>panies were<br />
initiated before UK and Dutch courts by third parties for alleged damages in connection with the<br />
prosecutions brought by the European Commission. At this point, the probability to have a favorable verdict<br />
and the financial impacts of these procedures are uncertain due to the number of legal difficulties they gave<br />
rise to, the lack of documented claims and evaluations of the alleged damages.<br />
Within the framework of the legal proceedings described above, a €30 million reserve is booked in the Group’s<br />
consolidated financial statements as of September 30, 2012.<br />
Whatever the evolution of the proceedings described above, the Group believes that their out<strong>com</strong>e should not have<br />
a material adverse effect on the Group’s financial situation or consolidated results.<br />
Grande Paroisse<br />
An explosion occurred at the Grande Paroisse industrial site in the city of Toulouse in France on September 21,<br />
2001. Grande Paroisse, a former subsidiary of Atofina which became a subsidiary of Elf Aquitaine Fertilisants on<br />
December 31, 2004, as part of the reorganization of the Chemicals segment, was principally engaged in the<br />
production and sale of agricultural fertilizers. The explosion, which involved a stockpile of ammonium nitrate pellets,<br />
destroyed a portion of the site and caused the death of thirty-one people, including twenty-one workers at the site,<br />
and injured many others. The explosion also caused significant damage to certain property in part of the city of<br />
Toulouse.<br />
This plant has been closed and individual assistance packages have been provided for employees. The site has<br />
been rehabilitated.<br />
On December 14, 2006, Grande Paroisse signed, under the supervision of the city of Toulouse, the deed whereby it<br />
donated the former site of the AZF plant to the greater agglomeration of Toulouse (CAGT) and the Caisse des<br />
dépôts et consignations and its subsidiary ICADE. Under this deed, TOTAL S.A. guaranteed the site restoration<br />
obligations of Grande Paroisse and granted a €10 million endowment to the InNaBioSanté research foundation as<br />
part of the setting up of a cancer research center at the site by the city of Toulouse.<br />
Regarding the cause of the explosion, the hypothesis that the explosion was caused by Grande Paroisse through<br />
the accidental mixing of hundreds of kilos of a chlorine <strong>com</strong>pound at a storage site for ammonium nitrate was<br />
discredited over the course of the investigation. As a result, proceedings against ten of the eleven Grande Paroisse<br />
employees charged during the criminal investigation conducted by the Toulouse Regional Court (Tribunal de grande<br />
instance) were dismissed and this dismissal was upheld on appeal. Nevertheless, the final experts’ report filed on<br />
May 11, 2006 has continued to focus on the hypothesis of a chemical accident, although this hypothesis has not<br />
been confirmed during the attempt to reconstruct the accident at the site. After having articulated several<br />
hypotheses, the experts no longer maintain that the accident was caused by pouring a large quantity of a chlorine<br />
<strong>com</strong>pound over ammonium nitrate. Instead, the experts have retained a scenario where a container of chlorine<br />
<strong>com</strong>pound sweepings was poured between a layer of wet ammonium nitrate covering the floor and a quantity of dry<br />
agricultural nitrate at a location not far from the principal storage site. This is claimed to have caused an explosion<br />
which then spread into the main storage site. Grande Paroisse was investigated based on this new hypothesis in<br />
2006; Grande Paroisse is contesting this explanation, which it believes to be based on elements that are not<br />
factually accurate.<br />
All the requests for additional investigations that were submitted by Grande Paroisse, the former site manager and<br />
various plaintiffs were denied on appeal after the end of the criminal investigation procedure. On July 9, 2007, the<br />
Annexe EV - 201209 Conseil d'Administration.docx Page 8 11/2/2012
investigating judge brought charges against Grande Paroisse and the former plant manager before the criminal<br />
chamber of the Court of Appeal of Toulouse. In late 2008, TOTAL S.A. and Mr. Thierry Desmarest were summoned<br />
to appear in Court pursuant to a request by a victims association. The trial for this case began on February 23, 2009,<br />
and lasted approximately four months.<br />
On November 19, 2009, the Toulouse Criminal Court acquitted both the former Plant Manager, and Grande Paroisse<br />
due to the lack of reliable evidence for the explosion. The Court also ruled that the summonses against TOTAL S.A.<br />
and Mr. Thierry Desmarest, Chairman and CEO at the time of the disaster, were inadmissible.<br />
Due to the presumption of civil liability that applied to Grande Paroisse, the Court declared Grande Paroisse civilly<br />
liable for the damages caused by the explosion to the victims in its capacity as custodian and operator of the plant.<br />
The Prosecutor’s office, together with certain third parties, has appealed the Toulouse Criminal Court verdict. In<br />
order to preserve its rights, Grande Paroisse lodged a cross-appeal with respect to civil charges.<br />
By its decision of September 24, 2012, the Court of Appeal of Toulouse (Cour d’appel de Toulouse) upheld the lower<br />
court verdict pursuant to which the summonses against TOTAL S.A. and Mr. Thierry Desmarest were determined to<br />
be inadmissible. This element of the decision has been appealed by certain third parties before the French Supreme<br />
Court (Cour de cassation).<br />
The Court of Appeal considered, however, that the explosion was the result of the chemical accident described by<br />
the court-appointed experts. Accordingly, it convicted the former plant manager and Grande Paroisse. This element<br />
of the decision has been appealed by the former plant manager and Grande Paroisse before the French Supreme<br />
Court (Cour de cassation), which has the effect of suspending their criminal sentences.<br />
A <strong>com</strong>pensation mechanism for victims was set up immediately following the explosion. €2.3 billion was paid for the<br />
<strong>com</strong>pensation of claims and related expenses amounts. As of September 30, 2012, a €17 million reserve remains<br />
recorded in the Group’s consolidated balance sheet.<br />
Buncefield<br />
On December 11, 2005, several explosions, followed by a major fire, occurred at an oil storage depot at Buncefield,<br />
north of London. This depot was operated by Hertfordshire Oil Storage Limited (HOSL), a <strong>com</strong>pany in which<br />
TOTAL’s UK subsidiary holds 60% and another oil group holds 40%.<br />
The explosion caused injuries, most of which were minor injuries, to a number of people and caused property<br />
damage to the depot and the buildings and homes located nearby. The official Independent Investigation Board has<br />
indicated that the explosion was caused by the overflow of a tank at the depot. The Board’s final report was released<br />
on December 11, 2008. The civil procedure for claims, which had not yet been settled, took place between October<br />
and December 2008. The Court’s decision of March 20, 2009, declared TOTAL’s UK subsidiary liable for the<br />
accident and solely liable for indemnifying the victims. The subsidiary appealed the decision. The appeal trial took<br />
place in January 2010. The Court of Appeals, by a decision handed down on March 4, 2010, confirmed the prior<br />
judgment. The Supreme Court of United Kingdom has partially authorized TOTAL’s UK subsidiary to contest the<br />
decision. TOTAL’s UK subsidiary finally decided to withdraw from this recourse due to settlement agreements<br />
reached in mid-February 2011.<br />
The Group carries insurance for damage to its interests in these facilities, business interruption and civil liability<br />
claims from third parties. The provision for the civil liability that appears in the Group’s consolidated financial<br />
statements as of September 30, 2012, stands at €3 million after taking into account the payments previously made.<br />
The Group believes that, based on the information currently available, on a reasonable estimate of its liability and on<br />
provisions recognized, this accident should not have a significant impact on the Group’s financial situation or<br />
consolidated results.<br />
In addition, on December 1, 2008, the Health and Safety Executive (HSE) and the Environment Agency (EA) issued<br />
a Notice of prosecution against five <strong>com</strong>panies, including TOTAL’s UK subsidiary. By a judgment on July 16, 2010,<br />
the subsidiary was fined £3.6 million and paid it. The decision takes into account a number of elements that have<br />
mitigated the impact of the charges brought against it.<br />
Erika<br />
Following the sinking in December 1999 of the Erika, a tanker that was transporting products belonging to one of the<br />
Group’s <strong>com</strong>panies, the Tribunal de grande instance of Paris convicted TOTAL S.A. of marine pollution pursuant to<br />
a judgment issued on January 16, 2008, finding that TOTAL S.A. was negligent in its vetting procedure for vessel<br />
selection, and ordering TOTAL S.A. to pay a fine of €375,000. The Court also ordered <strong>com</strong>pensation to be paid to<br />
those affected by the pollution from the Erika up to an aggregate amount of €192 million, declaring TOTAL S.A.<br />
jointly and severally liable for such payments together with the Erika’s inspection and classification firm, the Erika’s<br />
owner and the Erika’s manager.<br />
Annexe EV - 201209 Conseil d'Administration.docx Page 9 11/2/2012
TOTAL S.A. has appealed the verdict of January 16, 2008. In the meantime, it nevertheless proposed to pay third<br />
parties who so requested definitive and irrevocable <strong>com</strong>pensation as determined by the Tribunal. Forty-two third<br />
parties have been <strong>com</strong>pensated for an aggregate amount of €171.5 million.<br />
By a decision dated March 30, 2010, the Cour d’appel de Paris upheld the lower Court verdict pursuant to which<br />
TOTAL S.A. was convicted of marine pollution and fined €375,000.<br />
However, the Court of Appeal ruled that TOTAL S.A. bears no civil liability according to the applicable international<br />
conventions and consequently ruled that TOTAL S.A. be not convicted.<br />
TOTAL challenged the criminal law-related of this decision before the French Supreme Court (Cour de cassation).<br />
By a decision dated September 25, 2012, the Cour de cassation has dismissed the appeal lodged by TOTAL S.A.<br />
and upheld the conviction of marine pollution. The Cour de cassation also quashed the appeal judgment and ruled<br />
that TOTAL S.A. bears civil liability. Consequently, TOTAL S.A. has been declared severally liable together with the<br />
Erika’s inspection and classification firm, owner and manager to <strong>com</strong>pensate the damages allocated to third parties<br />
by the Cour d’appel de Paris in 2010.<br />
Nearly all the damages allocated to third parties have already been paid. Consequently, the decision of the Cour de<br />
cassation should not have a significant financial impact for the Group.<br />
TOTAL S.A. believes that, based on the information currently available, the case should not have a significant<br />
impact on the Group’s financial situation or consolidated results.<br />
Blue Rapid and the Russian Olympic Committee – Russian regions and Interneft<br />
Blue Rapid, a Panamanian <strong>com</strong>pany, and the Russian Olympic Committee filed a claim for damages with the Paris<br />
Commercial Court against Elf Aquitaine, alleging a so-called non-<strong>com</strong>pletion by a former subsidiary of Elf Aquitaine<br />
of a contract related to an exploration and production project in Russia negotiated in the early 1990s. Elf Aquitaine<br />
believed this claim to be unfounded and opposed it. On January 12, 2009, the Commercial Court of Paris rejected<br />
Blue Rapid’s claim against Elf Aquitaine and found that the Russian Olympic Committee did not have standing in the<br />
matter. Blue Rapid and the Russian Olympic Committee appealed this decision. On June 30, 2011, the Court of<br />
Appeal of Paris dismissed as inadmissible the claim of Blue Rapid and the Russian Olympic Committee against<br />
Elf Aquitaine, notably on the grounds of the contract’s termination. Blue Rapid and the Russian Olympic Committee<br />
appealed this decision to the French Supreme Court.<br />
In connection with the same facts, and fifteen years after the termination of the exploration and production contract,<br />
a Russian <strong>com</strong>pany, which was held not to be the contracting party to the contract, and two regions of the Russian<br />
Federation which were not even parties to the contract, have launched an arbitration procedure against the<br />
aforementioned former subsidiary of Elf Aquitaine that was liquidated in 2005, claiming alleged damages of $22.4<br />
billion. For the same reasons as those successfully adjudicated by Elf Aquitaine against Blue Rapid and the Russian<br />
Olympic Committee, the Group considers this claim to be unfounded as to a matter of law or fact. The Group has<br />
lodged a criminal <strong>com</strong>plaint to denounce the fraudulent claim which the Group believes it is a victim of and, has<br />
taken and reserved its rights to take other actions and measures to defend its interests.<br />
Iran<br />
In 2003, the United States Securities and Exchange Commission (SEC) followed by the Department of Justice (DoJ)<br />
issued a formal order directing an investigation in connection with the pursuit of business in Iran by certain oil<br />
<strong>com</strong>panies including, among others, TOTAL.<br />
The inquiry concerns an agreement concluded by the Company with consultants concerning gas fields in Iran and<br />
aims to verify whether certain payments made under this agreement would have benefited Iranian officials in<br />
violation of the Foreign Corrupt Practices Act (FCPA) and the Company’s accounting obligations. The Company fully<br />
cooperates with these investigations.<br />
Since 2010, the Company has been in discussions with U.S. authorities (DoJ and SEC) to consider, as it is often the<br />
case in these kinds of proceedings, an out-of-court settlement, which would terminate the investigation in exchange<br />
for TOTAL respecting a number of obligations, including the payment of a fine and civil <strong>com</strong>pensation, without<br />
admission of guilt.<br />
U.S. authorities have proposed draft agreements that could be accepted by TOTAL. Consequently, and although<br />
discussions have not yet been finalized, a provision of €308 million ($398 million) reflecting the best estimate of<br />
potential costs associated with the resolution of these proceedings, remains booked in the Group’s consolidated<br />
financial statements as of September 30, 2012.<br />
In this same affair, TOTAL and its Chief Executive Officer, President of the Middle East at the time of the facts, have<br />
been placed under formal investigation, following a judicial inquiry initiated in France in 2006.<br />
At this point, the Company considers that the resolution of these cases is not expected to have a significant impact<br />
on the Group’s financial situation or consequences on its future planned operations.<br />
Annexe EV - 201209 Conseil d'Administration.docx Page 10 11/2/2012
Libya<br />
In June 2011, the United States Securities and Exchange Commission (SEC) issued to certain oil <strong>com</strong>panies -<br />
including, among others, TOTAL - a formal request for information related to their operations in Libya. TOTAL is<br />
cooperating with this non public investigation.<br />
Oil-for-Food Program<br />
Several countries have launched investigations concerning possible violations related to the United Nations (UN) Oilfor-Food<br />
program in Iraq.<br />
Pursuant to a French criminal investigation, certain current or former Group employees were placed under formal<br />
criminal investigation for possible charges as accessories to the misappropriation of corporate assets and as<br />
accessories to the corruption of foreign public agents. The Chairman and Chief Executive Officer of the Company,<br />
formerly President of the Group’s Exploration & Production division, was also placed under formal investigation in<br />
October 2006. In 2007, the criminal investigation was closed and the case was transferred to the Prosecutor’s office.<br />
In 2009, the Prosecutor’s office re<strong>com</strong>mended to the investigating judge that the case against the Group’s current<br />
and former employees and TOTAL’s Chairman and Chief Executive Officer not be pursued.<br />
In early 2010, despite the re<strong>com</strong>mendation of the Prosecutor’s office, a new investigating judge, having taken over<br />
the case, decided to indict TOTAL S.A. on bribery charges as well as <strong>com</strong>plicity and influence peddling. The<br />
indictment was brought eight years after the beginning of the investigation without any new evidence being<br />
introduced.<br />
In October 2010, the Prosecutor’s office re<strong>com</strong>mended to the investigating judge that the case against TOTAL S.A.,<br />
the Group’s current and former employees and TOTAL’s Chairman and Chief Executive Officer not be pursued.<br />
However, by ordinance notified in early August 2011, the investigating judge on the matter decided to send the case<br />
to trial. The hearings are expected in the first quarter of 2013.<br />
The Company believes that its activities related to the Oil-for-Food program have been in <strong>com</strong>pliance with this<br />
program, as organized by the UN in 1996.<br />
The Volcker report released by the independent investigating <strong>com</strong>mittee set up by the UN had discarded any bribery<br />
grievance within the framework of the Oil-For-Food program with respect to TOTAL.<br />
Italy<br />
As part of an investigation led by the Prosecutor of the Republic of the Potenza Court, <strong>Total</strong> Italia and certain<br />
Group’s employees are the subject of an investigation related to certain calls for tenders that <strong>Total</strong> Italia made for the<br />
preparation and development of an oil field. On February 16, 2009, as a preliminary measure before the proceedings<br />
go before the Court, the preliminary investigation judge of Potenza served notice to <strong>Total</strong> Italia of a decision that<br />
would suspend the concession for this field for one year. <strong>Total</strong> Italia has appealed the decision by the preliminary<br />
investigation judge before the Court of Appeal of Potenza. In a decision dated April 8, 2009, the Court reversed the<br />
suspension of the Gorgoglione concession and appointed for one year, i.e. until February 16, 2010, a judicial<br />
administrator to supervise the operations related to the development of the concession, allowing the Tempa Rossa<br />
project to continue.<br />
The criminal investigation was closed in the first half of 2010.<br />
In May 2012, the Judge of the preliminary hearing decided to dismiss the charges for some of the Goup’s employees<br />
and refer the case for trial for a reduced number of charges. The trial started on September 26, 2012.In 2010, <strong>Total</strong><br />
Italia’s exploration and production operations were transferred to <strong>Total</strong> E&P Italia and refining and marketing<br />
operations were merged with those of Erg Petroli.<br />
Rivunion<br />
On July 9, 2012, the Swiss Tribunal Fédéral (Switzerland’s Supreme Court) rendered its decision against Rivunion, a<br />
wholly-owned subsidiary of Elf Aquitaine, confirming a tax reassessment in the amount of CHF 171 million<br />
(excluding interest for late payment, yet to be calculated by the <strong>com</strong>petent authorities). According to the Tribunal,<br />
Rivunion was held liable as tax collector of withholding taxes owed by the beneficiaries of taxable services. Rivunion,<br />
in liquidation since March 12, 2002, unable to recover the amounts corresponding to the withholding taxes in<br />
restitution from said beneficiaries in order to meet its fiscal obligations, should undergo insolvency proceedings<br />
shortly.<br />
Annexe EV - 201209 Conseil d'Administration.docx Page 11 11/2/2012
Elgin<br />
Following a gas leak starting on March 25, 2012, from the G4 well on the platform of the Elgin field in the North Sea<br />
(United Kingdom), the production from the Elgin, Franklin and West Franklin fields was stopped and the site’s<br />
personnel was evacuated. No injuries to personnel have occurred, and the risk to the environment is expected to be<br />
relatively minor.<br />
TOTAL immediately launched its emergency response plan and mobilized crisis management teams. The Group<br />
also mobilized international well control experts.<br />
As from April 6, 2012, teams <strong>com</strong>prised of TOTAL experts and specialists engaged by the Group conducted<br />
numerous missions to the Elgin platform in order to prepare and implement the intervention plans for controlling the<br />
leak from the G4 well.<br />
On May 21, 2012, TOTAL confirmed, following five days of close monitoring, the success of the intervention<br />
conducted on May 15, 2012 to stop the gas leak of the G4 well. Injecting heavy mud into the G4 well allowed the<br />
regaining of control over the well. Since then, several inspection visits conducted on the wellhead platform have<br />
confirmed that the leak was <strong>com</strong>pletely stopped.<br />
Following the success of this intervention, a new phase of the intervention plan was launched with the objective of<br />
<strong>com</strong>pleting the permanent plugging and abandonment procedure of the G4 well. Since June 2012, the Elgin <strong>com</strong>plex<br />
has been progressively re-manned and, the operation to permanently secure the G4 well is in the process of being<br />
finalized following the implementation of the fifth cement plug.<br />
In parallel, TOTAL and the British authorities are continuing their investigations to understand the reasons for the<br />
accident and determine the measures to be taken to allow the restart of production of the Elgin, Franklin and West<br />
Franklin fields in the best conditions.<br />
TOTAL is the operator of the Elgin, Franklin and West Franklin fields and holds an interest of 46.17% since the end<br />
of 2011 via the Elgin Franklin Oil & Gas (EFOG) <strong>com</strong>pany. As of September 30, 2012, TOTAL estimates the impact<br />
generated by the loss of production from these three fields (Group share) at $1.5 million (approximately €1.2 million)<br />
a day on the Group’s net operating in<strong>com</strong>e.<br />
Nigeria (OML 58)<br />
On April 3, 2012, TOTAL E&P Nigeria Ltd (TEPNG), a subsidiary of the Group, was informed about water and gas<br />
resurgence points observed in an uninhabited area close to its onshore gas production facilities on the OML 58<br />
license. This event was the consequence of a technical incident that occurred March 20, 2012 on the Ibewa gas<br />
production site: a gas producing well (IBW16) was intersected during the drilling operations of a new well (OB127b),<br />
which resulted in gas flowing from the production well into intermediate geological layers. The Obite treatment gas<br />
plant was stopped and the other wells shut down and secured.<br />
In close collaboration with representatives of the local <strong>com</strong>munities and the Nigerian authorities, all necessary<br />
means to ensure the protection of nearby <strong>com</strong>munities and personnel and to limit the impact on the environment<br />
have been immediately mobilized. Very important technical means, as well as experts of the Group and specialized<br />
<strong>com</strong>panies have also been mobilized on site to regain control of the well and stop the flow of gas.<br />
On May 18, 2012, TEPNG confirmed the success of the intervention conducted on the Ibewa 16 well to stop the gas<br />
leak. Cement plugs have been set to ensure the isolation of the reservoir. The activity of the gas resurgences<br />
decreased in intensity immediately after this intervention, and stopped within a few days. TOTAL teams are still<br />
maintaining a regular monitoring of the water and air quality. A <strong>com</strong>prehensive review of the environmental impact is<br />
underway in liaison with the authorities.<br />
The Obite gas treatment plant was restarted, with the exception of wells damaged by the incident, and gas<br />
production from the site was resumed, finding a level close to the pre-incident levels up until the 7 th October 2012.<br />
TOTAL E&P Nigeria Ltd operates the OML 58 license as part of the joint venture between TOTAL and the Nigerian<br />
National Petroleum Corporation, and holds a 40% stake in this permit. As of September 30, 2012, TOTAL estimates<br />
the total impact of the loss of production generated by the above incident at about $32 million (around €25 million)<br />
on the Group’s net operating in<strong>com</strong>e.<br />
For these two events, in line with industry practice and local regulation, TOTAL has insurance policies in place.<br />
The actions taken to resolve the Elgin and OML 58 situations described above, led to the accounting of a €63 million<br />
charge in net operating in<strong>com</strong>e in the Group’s consolidated financial statements as of September 30, 2012. This<br />
amount will be reevaluated in light of future events.<br />
Annexe EV - 201209 Conseil d'Administration.docx Page 12 11/2/2012
The flooding that is occurring in several countries of the Gulf of Guinea, including Nigeria, has had some impact on<br />
several onshore facilities. With respect to <strong>Total</strong> E&P Nigeria, facilities of OML58 are shutdown since October 7,<br />
2012. <strong>Total</strong> has established an assistance program to provide support to the local population affected.<br />
Yemen<br />
The Yemen LNG <strong>com</strong>pany (39.62%) underwent since March 30, 2012 six acts of sabotage on the 38 inch gas<br />
pipeline that links block 18 to the Balhaf facility on the Gulf of Aden. These acts of sabotage have led to short-term<br />
production stops of LNG. Prompt repairs permitted to limit the number of shipments canceled accordingly. Safety<br />
and monitoring measures were strengthened along the gas pipeline and around the LNG plant, which produces at<br />
full capacity since October 5, 2012.<br />
Annexe EV - 201209 Conseil d'Administration.docx Page 13 11/2/2012
8) Information by business segment<br />
9 months 2012<br />
(M€)<br />
Upstream<br />
Refining<br />
Chemicals<br />
Supply<br />
Marketing<br />
Corporate Inter<strong>com</strong>pany <strong>Total</strong><br />
Non-Group sales 16,155 68,948 64,945 145 - 150,193<br />
Intersegment sales 23,440 33,457 607 140 (57,644) -<br />
Excise taxes - (2,634) (10,729) - - (13,363)<br />
Revenues from sales 39,595 99,771 54,823 285 (57,644) 136,830<br />
Operating expenses (18,008) (97,617) (53,588) (764) 57,644 (112,333)<br />
Depreciation, depletion and amortization of tangible assets and mineral interests (5,685) (954) (447) (26) - (7,112)<br />
Operating in<strong>com</strong>e 15,902 1,200 788 (505) - 17,385<br />
Equity in net in<strong>com</strong>e (loss) of affiliates and other items 1,633 156 (76) 263 - 1,976<br />
Tax on net operating in<strong>com</strong>e (9,858) (306) (299) (129) - (10,592)<br />
Net operating in<strong>com</strong>e 7,677 1,050 413 (371) - 8,769<br />
Net cost of net debt (346)<br />
Non-controlling interests (110)<br />
Net in<strong>com</strong>e 8,313<br />
9 months 2012 (adjustments) (a)<br />
(M€)<br />
Upstream<br />
Refining<br />
Chemicals<br />
Supply<br />
Marketing<br />
Corporate Inter<strong>com</strong>pany <strong>Total</strong><br />
Non-Group sales (22) - - - - (22)<br />
Intersegment sales - - - - -<br />
Excise taxes - - - - -<br />
Revenues from sales (22) - - - - (22)<br />
Operating expenses (15) 138 (127) (88) - (92)<br />
Depreciation, depletion and amortization of tangible assets and mineral interests (1,134) (2) (60) - - (1,196)<br />
Operating in<strong>com</strong>e (b)<br />
(1,171) 136 (187) (88) - (1,310)<br />
Equity in net in<strong>com</strong>e (loss) of affiliates and other items - (12) 4 159 - 151<br />
Tax on net operating in<strong>com</strong>e 341 (82) 32 (106) - 185<br />
Net operating in<strong>com</strong>e (b)<br />
(830) 42 (151) (35) - (974)<br />
Net cost of net debt -<br />
Non-controlling interests 7<br />
Net in<strong>com</strong>e (967)<br />
(a) Adjustments include special items, inventory valuation effect and the effect of changes in fair value.<br />
(b)<br />
Of which inventory valuation effect<br />
On operating in<strong>com</strong>e - 172 56 -<br />
On net operating in<strong>com</strong>e - 120 35 -<br />
(c) Of which equity share of adjustments related to Sanofi-Aventis - - - -<br />
9 months 2012 (adjusted)<br />
(M€) (a)<br />
Upstream<br />
Refining<br />
Chemicals<br />
Supply<br />
Marketing<br />
Corporate Inter<strong>com</strong>pany <strong>Total</strong><br />
Non-Group sales 16,177 68,948 64,945 145 - 150,215<br />
Intersegment sales 23,440 33,457 607 140 (57,644) -<br />
Excise taxes - (2,634) (10,729) - - (13,363)<br />
Revenues from sales 39,617 99,771 54,823 285 (57,644) 136,852<br />
Operating expenses (17,993) (97,755) (53,461) (676) 57,644 (112,241)<br />
Depreciation, depletion and amortization of tangible assets and mineral interests (4,551) (952) (387) (26) - (5,916)<br />
Adjusted operating in<strong>com</strong>e 17,073 1,064 975 (417) - 18,695<br />
Equity in net in<strong>com</strong>e (loss) of affiliates and other items 1,633 168 (80) 104 - 1,825<br />
Tax on net operating in<strong>com</strong>e (10,199) (224) (331) (23) - (10,777)<br />
Adjusted net operating in<strong>com</strong>e 8,507 1,008 564 (336) - 9,743<br />
Net cost of net debt (346)<br />
Non-controlling interests (117)<br />
Ajusted net in<strong>com</strong>e 9,280<br />
Adjusted fully-diluted earnings per share (€) 4.10<br />
(a) Except for per share amounts.<br />
9 months 2012<br />
(M€)<br />
Upstream<br />
Refining<br />
Chemicals<br />
Supply<br />
Marketing<br />
Corporate Inter<strong>com</strong>pany <strong>Total</strong><br />
<strong>Total</strong> expenditures 14,100 1,371 793 56 - 16,320<br />
<strong>Total</strong> divestments 1,383 203 106 2,613 - 4,305<br />
Cash flow from operating activities 14,521 1,625 108 343 - 16,597<br />
Annexe EV - 201209 Conseil d'Administration.docx Page 14 11/2/2012
9 months 2011<br />
(M€)<br />
Upstream<br />
Refining<br />
Chemicals<br />
Supply<br />
Marketing<br />
Corporate Inter<strong>com</strong>pany <strong>Total</strong><br />
Non-Group sales 16,079 57,741 63,367 14 - 137,201<br />
Intersegment sales 19,851 32,198 615 129 (52,793) -<br />
Excise taxes - (1,483) (12,126) - - (13,609)<br />
Revenues from sales 35,930 88,456 51,856 143 (52,793) 123,592<br />
Operating expenses (15,883) (85,997) (50,369) (450) 52,793 (99,906)<br />
Depreciation, depletion and amortization of tangible assets and mineral interests (3,602) (1,106) (356) (26) - (5,090)<br />
Operating in<strong>com</strong>e 16,445 1,353 1,131 (333) - 18,596<br />
Equity in net in<strong>com</strong>e (loss) of affiliates and other items 1,874 608 118 294 - 2,894<br />
Tax on net operating in<strong>com</strong>e (10,233) (444) (341) (12) - (11,030)<br />
Net operating in<strong>com</strong>e 8,086 1,517 908 (51) - 10,460<br />
Net cost of net debt (263)<br />
Non-controlling interests (211)<br />
Net in<strong>com</strong>e 9,986<br />
9 months 2011 (adjustments) (a)<br />
(M€)<br />
Upstream<br />
Refining<br />
Chemicals<br />
Supply<br />
Marketing<br />
Corporate Inter<strong>com</strong>pany <strong>Total</strong><br />
Non-Group sales 15 - - - - 15<br />
Intersegment sales - - - - - -<br />
Excise taxes - - - - - -<br />
Revenues from sales 15 - - - - 15<br />
Operating expenses - 785 229 - - 1,014<br />
Depreciation, depletion and amortization of tangible assets and mineral interests (75) (171) - - - (246)<br />
Operating in<strong>com</strong>e (b)<br />
(60) 614 229 - - 783<br />
Equity in net in<strong>com</strong>e (loss) of affiliates and other items 722 405 106 69 - 1,302<br />
Tax on net operating in<strong>com</strong>e (326) (315) (78) (73) - (792)<br />
Net operating in<strong>com</strong>e (b)<br />
336 704 257 (4) - 1,293<br />
Net cost of net debt -<br />
Non-controlling interests (6)<br />
Net in<strong>com</strong>e 1,287<br />
(a) Adjustments include special items, inventory valuation effect and the effect of changes in fair value.<br />
(b)<br />
Of which inventory valuation effect<br />
On operating in<strong>com</strong>e - 904 253 -<br />
On net operating in<strong>com</strong>e - 629 178 -<br />
(c) Of which equity share of adjustments related to Sanofi - - - -<br />
9 months 2011 (adjusted)<br />
(M€) (a)<br />
Upstream<br />
Refining<br />
Chemicals<br />
Supply<br />
Marketing<br />
Corporate Inter<strong>com</strong>pany <strong>Total</strong><br />
Non-Group sales 16,064 57,741 63,367 14 - 137,186<br />
Intersegment sales 19,851 32,198 615 129 (52,793) -<br />
Excise taxes - (1,483) (12,126) - - (13,609)<br />
Revenues from sales 35,915 88,456 51,856 143 (52,793) 123,577<br />
Operating expenses (15,883) (86,782) (50,598) (450) 52,793 (100,920)<br />
Depreciation, depletion and amortization of tangible assets and mineral interests (3,527) (935) (356) (26) - (4,844)<br />
Adjusted operating in<strong>com</strong>e 16,505 739 902 (333) - 17,813<br />
Equity in net in<strong>com</strong>e (loss) of affiliates and other items 1,152 203 12 225 - 1,592<br />
Tax on net operating in<strong>com</strong>e (9,907) (129) (263) 61 - (10,238)<br />
Adjusted net operating in<strong>com</strong>e 7,750 813 651 (47) - 9,167<br />
Net cost of net debt (263)<br />
Non-controlling interests (205)<br />
Ajusted net in<strong>com</strong>e 8,699<br />
Adjusted fully-diluted earnings per share (€) 3.86<br />
(a) Except for per share amounts.<br />
9 months 2011<br />
(M€)<br />
Upstream<br />
Refining<br />
Chemicals<br />
Supply<br />
Marketing<br />
Corporate Inter<strong>com</strong>pany <strong>Total</strong><br />
<strong>Total</strong> expenditures 14,528 1,286 1,289 71 - 17,174<br />
<strong>Total</strong> divestments 2,192 2,451 1,428 1,012 - 7,083<br />
Cash flow from operating activities 13,497 2,795 407 43 - 16,742<br />
Annexe EV - 201209 Conseil d'Administration.docx Page 15 11/2/2012
3 rd quarter 2012<br />
(M€)<br />
Upstream<br />
Refining<br />
Chemicals<br />
Supply<br />
Marketing<br />
Corporate Inter<strong>com</strong>pany <strong>Total</strong><br />
Non-Group sales 5,001 23,260 21,574 55 - 49,890<br />
Intersegment sales 7,455 11,168 154 47 (18,824) -<br />
Excise taxes - (956) (3,455) - - (4,411)<br />
Revenues from sales 12,456 33,472 18,273 102 (18,824) 45,479<br />
Operating expenses (5,279) (31,914) (17,836) (249) 18,824 (36,454)<br />
Depreciation, depletion and amortization of tangible assets and mineral interests (2,779) (321) (136) (10) - (3,246)<br />
Operating in<strong>com</strong>e 4,398 1,237 301 (157) - 5,779<br />
Equity in net in<strong>com</strong>e (loss) of affiliates and other items 642 41 7 302 - 992<br />
Tax on net operating in<strong>com</strong>e (2,961) (348) (81) (119) - (3,509)<br />
Net operating in<strong>com</strong>e 2,079 930 227 26 - 3,262<br />
Net cost of net debt (125)<br />
Non-controlling interests (71)<br />
Net in<strong>com</strong>e 3,066<br />
3 rd quarter 2012 (adjustments) (a)<br />
(M€)<br />
Upstream<br />
Refining<br />
Chemicals<br />
Supply<br />
Marketing<br />
Corporate Inter<strong>com</strong>pany <strong>Total</strong><br />
Non-Group sales (8) - - - - (8)<br />
Intersegment sales - - - - -<br />
Excise taxes - - - - -<br />
Revenues from sales (8) - - - - (8)<br />
Operating expenses 3 593 (42) - - 554<br />
Depreciation, depletion and amortization of tangible assets and mineral interests (1,134) (2) (14) - - (1,150)<br />
Operating in<strong>com</strong>e (b)<br />
(1,139) 591 (56) - - (604)<br />
Equity in net in<strong>com</strong>e (loss) of affiliates and other items - 5 33 293 - 331<br />
Tax on net operating in<strong>com</strong>e 327 (230) 7 (90) - 14<br />
Net operating in<strong>com</strong>e (b)<br />
(812) 366 (16) 203 - (259)<br />
Net cost of net debt -<br />
Non-controlling interests (23)<br />
Net in<strong>com</strong>e (282)<br />
(a) Adjustments include special items, inventory valuation effect and the effect of changes in fair value.<br />
(b)<br />
Of which inventory valuation effect<br />
On operating in<strong>com</strong>e - 627 139 -<br />
On net operating in<strong>com</strong>e - 444 94 -<br />
(c) Of which equity share of adjustments related to Sanofi-Aventis - - - -<br />
3 rd quarter 2012 (adjusted)<br />
(M€) (a)<br />
Upstream<br />
Refining<br />
Chemicals<br />
Supply<br />
Marketing<br />
Corporate Inter<strong>com</strong>pany <strong>Total</strong><br />
Non-Group sales 5,009 23,260 21,574 55 - 49,898<br />
Intersegment sales 7,455 11,168 154 47 (18,824) -<br />
Excise taxes - (956) (3,455) - - (4,411)<br />
Revenues from sales 12,464 33,472 18,273 102 (18,824) 45,487<br />
Operating expenses (5,282) (32,507) (17,794) (249) 18,824 (37,008)<br />
Depreciation, depletion and amortization of tangible assets and mineral interests (1,645) (319) (122) (10) - (2,096)<br />
Adjusted operating in<strong>com</strong>e 5,537 646 357 (157) - 6,383<br />
Equity in net in<strong>com</strong>e (loss) of affiliates and other items 642 36 (26) 9 - 661<br />
Tax on net operating in<strong>com</strong>e (3,288) (118) (88) (29) - (3,523)<br />
Adjusted net operating in<strong>com</strong>e 2,891 564 243 (177) - 3,521<br />
Net cost of net debt (125)<br />
Non-controlling interests (48)<br />
Ajusted net in<strong>com</strong>e 3,348<br />
Adjusted fully-diluted earnings per share (€) 1.48<br />
(a) Except for per share amounts.<br />
3 rd quarter 2012<br />
(M€)<br />
Upstream<br />
Refining<br />
Chemicals<br />
Supply<br />
Marketing<br />
Corporate Inter<strong>com</strong>pany <strong>Total</strong><br />
<strong>Total</strong> expenditures 4,567 441 383 25 - 5,416<br />
<strong>Total</strong> divestments 401 55 41 1,138 - 1,635<br />
Cash flow from operating activities 3,457 1,036 692 (22) - 5,163<br />
Annexe EV - 201209 Conseil d'Administration.docx Page 16 11/2/2012
3 rd quarter 2011<br />
(M€)<br />
Upstream<br />
Refining<br />
Chemicals<br />
Supply<br />
Marketing<br />
Corporate Inter<strong>com</strong>pany <strong>Total</strong><br />
Non-Group sales 4,770 19,267 22,124 2 - 46,163<br />
Intersegment sales 6,571 11,190 218 45 (18,024) -<br />
Excise taxes - (502) (4,136) - - (4,638)<br />
Revenues from sales 11,341 29,955 18,206 47 (18,024) 41,525<br />
Operating expenses (4,904) (29,539) (17,766) (136) 18,024 (34,321)<br />
Depreciation, depletion and amortization of tangible assets and mineral interests (1,262) (473) (129) (9) - (1,873)<br />
Operating in<strong>com</strong>e 5,175 (57) 311 (98) - 5,331<br />
Equity in net in<strong>com</strong>e (loss) of affiliates and other items 974 496 118 24 - 1,612<br />
Tax on net operating in<strong>com</strong>e (3,420) 9 (93) 41 - (3,463)<br />
Net operating in<strong>com</strong>e 2,729 448 336 (33) - 3,480<br />
Net cost of net debt (133)<br />
Non-controlling interests (33)<br />
Net in<strong>com</strong>e 3,314<br />
3 rd quarter 2011 (adjustments) (a)<br />
(M€)<br />
Upstream<br />
Refining<br />
Chemicals<br />
Supply<br />
Marketing<br />
Corporate Inter<strong>com</strong>pany <strong>Total</strong><br />
Non-Group sales (14) - - - - (14)<br />
Intersegment sales - - - - - -<br />
Excise taxes - - - - - -<br />
Revenues from sales (14) - - - - (14)<br />
Operating expenses - (191) (1) - - (192)<br />
Depreciation, depletion and amortization of tangible assets and mineral interests (75) (171) - - - (246)<br />
Operating in<strong>com</strong>e (b)<br />
(89) (362) (1) - - (452)<br />
Equity in net in<strong>com</strong>e (loss) of affiliates and other items 554 410 148 15 - 1,127<br />
Tax on net operating in<strong>com</strong>e (124) 33 (6) (71) - (168)<br />
Net operating in<strong>com</strong>e (b)<br />
341 81 141 (56) - 507<br />
Net cost of net debt -<br />
Non-controlling interests 6<br />
Net in<strong>com</strong>e 513<br />
(a) Adjustments include special items, inventory valuation effect and the effect of changes in fair value.<br />
(b)<br />
Of which inventory valuation effect<br />
On operating in<strong>com</strong>e - (121) 9 -<br />
On net operating in<strong>com</strong>e - (93) 3 -<br />
(c) Of which equity share of adjustments related to Sanofi - - - -<br />
3 rd quarter 2011 (adjusted)<br />
(M€) (a)<br />
Upstream<br />
Refining<br />
Chemicals<br />
Supply<br />
Marketing<br />
Corporate Inter<strong>com</strong>pany <strong>Total</strong><br />
Non-Group sales 4,784 19,267 22,124 2 - 46,177<br />
Intersegment sales 6,571 11,190 218 45 (18,024) -<br />
Excise taxes - (502) (4,136) - - (4,638)<br />
Revenues from sales 11,355 29,955 18,206 47 (18,024) 41,539<br />
Operating expenses (4,904) (29,348) (17,765) (136) 18,024 (34,129)<br />
Depreciation, depletion and amortization of tangible assets and mineral interests (1,187) (302) (129) (9) - (1,627)<br />
Adjusted operating in<strong>com</strong>e 5,264 305 312 (98) - 5,783<br />
Equity in net in<strong>com</strong>e (loss) of affiliates and other items 420 86 (30) 9 - 485<br />
Tax on net operating in<strong>com</strong>e (3,296) (24) (87) 112 - (3,295)<br />
Adjusted net operating in<strong>com</strong>e 2,388 367 195 23 - 2,973<br />
Net cost of net debt (133)<br />
Non-controlling interests (39)<br />
Ajusted net in<strong>com</strong>e 2,801<br />
Adjusted fully-diluted earnings per share (€) 1.24<br />
(a) Except for per share amounts.<br />
3 rd quarter 2011<br />
(M€)<br />
Upstream<br />
Refining<br />
Chemicals<br />
Supply<br />
Marketing<br />
Corporate Inter<strong>com</strong>pany <strong>Total</strong><br />
<strong>Total</strong> expenditures 3,426 423 48 24 - 3,921<br />
<strong>Total</strong> divestments 936 2,422 1,380 344 - 5,082<br />
Cash flow from operating activities 4,042 * 1,557 516 (151) * - 5,964<br />
* Reclassification of inter<strong>com</strong>pany transactions between Upstream and Corporate for €823 million with no impact on the total of cash flow from operating activities<br />
Annexe EV - 201209 Conseil d'Administration.docx Page 17 11/2/2012
9) Reconciliation of the information by business segment with consolidated financial<br />
statements<br />
9 months 2012<br />
(M€)<br />
Adjusted Adjustments (a)<br />
Consolidated<br />
statement of<br />
in<strong>com</strong>e<br />
Sales 150,215 (22) 150,193<br />
Excise taxes (13,363) - (13,363)<br />
Revenues from sales 136,852 (22) 136,830<br />
Purchases net of inventory variation (95,172) 228 (94,944)<br />
Other operating expenses (16,127) (320) (16,447)<br />
Exploration costs (942) - (942)<br />
Depreciation, depletion and amortization of tangible assets and mineral interests (5,916) (1,196) (7,112)<br />
Other in<strong>com</strong>e 447 541 988<br />
Other expense (314) (362) (676)<br />
Financial interest on debt (511) - (511)<br />
Financial in<strong>com</strong>e from marketable securities & cash equivalents 67 - 67<br />
Cost of net debt (444) - (444)<br />
Other financial in<strong>com</strong>e 435 - 435<br />
Other financial expense (389) - (389)<br />
Equity in net in<strong>com</strong>e (loss) of affiliates 1,646 (28) 1,618<br />
In<strong>com</strong>e taxes (10,679) 185 (10,494)<br />
Consolidated net in<strong>com</strong>e 9,397 (974) 8,423<br />
Group share 9,280 (967) 8,313<br />
Non-controlling interests 117 (7) 110<br />
(a) Adjustments include special items, inventory valuation effect and the effect of changes in fair value.<br />
9 months 2011<br />
(M€)<br />
Adjusted Adjustments (a)<br />
Consolidated<br />
statement of<br />
in<strong>com</strong>e<br />
Sales 137,186 15 137,201<br />
Excise taxes (13,609) - (13,609)<br />
Revenues from sales 123,577 15 123,592<br />
Purchases net of inventory variation (85,816) 1,157 (84,659)<br />
Other operating expenses (14,424) (143) (14,567)<br />
Exploration costs (680) - (680)<br />
Depreciation, depletion and amortization of tangible assets and mineral interests (4,844) (246) (5,090)<br />
Other in<strong>com</strong>e 178 1,487 1,665<br />
Other expense (224) (185) (409)<br />
Financial interest on debt (557) - (557)<br />
Financial in<strong>com</strong>e from marketable securities & cash equivalents 216 - 216<br />
Cost of net debt (341) - (341)<br />
Other financial in<strong>com</strong>e 518 - 518<br />
Other financial expense (327) - (327)<br />
Equity in net in<strong>com</strong>e (loss) of affiliates 1,447 - 1,447<br />
In<strong>com</strong>e taxes (10,160) (792) (10,952)<br />
Consolidated net in<strong>com</strong>e 8,904 1,293 10,197<br />
Group share 8,699 1,287 9,986<br />
Non-controlling interests 205 6 211<br />
(a) Adjustments include special items, inventory valuation effect and the effect of changes in fair value.<br />
Annexe EV - 201209 Conseil d'Administration.docx Page 18 11/2/2012
3 rd quarter 2012<br />
(M€)<br />
Adjusted Adjustments (a)<br />
Consolidated<br />
statement of<br />
in<strong>com</strong>e<br />
Sales 49,898 (8) 49,890<br />
Excise taxes (4,411) - (4,411)<br />
Revenues from sales 45,487 (8) 45,479<br />
Purchases net of inventory variation (31,375) 766 (30,609)<br />
Other operating expenses (5,316) (212) (5,528)<br />
Exploration costs (317) - (317)<br />
Depreciation, depletion and amortization of tangible assets and mineral interests (2,096) (1,150) (3,246)<br />
Other in<strong>com</strong>e 142 332 474<br />
Other expense (114) (15) (129)<br />
Financial interest on debt (154) - (154)<br />
Financial in<strong>com</strong>e from marketable securities & cash equivalents 8 - 8<br />
Cost of net debt (146) - (146)<br />
Other financial in<strong>com</strong>e 141 - 141<br />
Other financial expense (135) - (135)<br />
Equity in net in<strong>com</strong>e (loss) of affiliates 627 14 641<br />
In<strong>com</strong>e taxes (3,502) 14 (3,488)<br />
Consolidated net in<strong>com</strong>e 3,396 (259) 3,137<br />
Group share 3,348 (282) 3,066<br />
Non-controlling interests 48 23 71<br />
(a) Adjustments include special items, inventory valuation effect and the effect of changes in fair value.<br />
3 rd quarter 2011<br />
(M€)<br />
Adjusted Adjustments (a)<br />
Consolidated<br />
statement of<br />
in<strong>com</strong>e<br />
Sales 46,177 (14) 46,163<br />
Excise taxes (4,638) - (4,638)<br />
Revenues from sales 41,539 (14) 41,525<br />
Purchases net of inventory variation (28,906) (112) (29,018)<br />
Other operating expenses (4,981) (80) (5,061)<br />
Exploration costs (242) - (242)<br />
Depreciation, depletion and amortization of tangible assets and mineral interests (1,627) (246) (1,873)<br />
Other in<strong>com</strong>e 69 1,265 1,334<br />
Other expense (95) (117) (212)<br />
Financial interest on debt (262) - (262)<br />
Financial in<strong>com</strong>e from marketable securities & cash equivalents 114 - 114<br />
Cost of net debt (148) - (148)<br />
Other financial in<strong>com</strong>e 108 - 108<br />
Other financial expense (115) - (115)<br />
Equity in net in<strong>com</strong>e (loss) of affiliates 518 (21) 497<br />
In<strong>com</strong>e taxes (3,280) (168) (3,448)<br />
Consolidated net in<strong>com</strong>e 2,840 507 3,347<br />
Group share 2,801 513 3,314<br />
Non-controlling interests 39 (6) 33<br />
(a) Adjustments include special items, inventory valuation effect and the effect of changes in fair value.<br />
Annexe EV - 201209 Conseil d'Administration.docx Page 19 11/2/2012
10) Sales by business segment<br />
(M€) Upstream<br />
1 st quarter 2012<br />
Refining &<br />
Chemicals<br />
Supply Marketing Corporate Inter<strong>com</strong>pany <strong>Total</strong><br />
Non-Group sales 6,177 23,096 21,852 43 - 51,168<br />
Intersegment sales 8,234 11,815 231 45 (20,325) -<br />
Excise taxes - (804) (3,588) (1) - (4,393)<br />
Revenues from sales 14,411 34,107 18,495 87 (20,325) 46,775<br />
2 nd quarter 2012<br />
Non-Group sales 4,977 22,592 21,519 47 - 49,135<br />
Intersegment sales 7,751 10,474 222 48 (18,495) -<br />
Excise taxes - (874) (3,686) 1 - (4,559)<br />
Revenues from sales 12,728 32,192 18,055 96 (18,495) 44,576<br />
3 rd quarter 2012<br />
Non-Group sales 5,001 23,260 21,574 55 - 49,890<br />
Intersegment sales 7,455 11,168 154 47 (18,824) -<br />
Excise taxes - (956) (3,455) - - (4,411)<br />
Revenues from sales 12,456 33,472 18,273 102 (18,824) 45,479<br />
9 months 2012<br />
Non-Group sales 16,155 68,948 64,945 145 - 150,193<br />
Intersegment sales 23,440 33,457 607 140 (57,644) -<br />
Excise taxes - (2,634) (10,729) - - (13,363)<br />
Revenues from sales 39,595 99,771 54,823 285 (57,644) 136,830<br />
1 st quarter 2011<br />
Non-Group sales 6,144 19,385 20,489 11 - 46,029<br />
Intersegment sales 6,939 10,662 239 41 (17,881) -<br />
Excise taxes - (475) (3,952) - - (4,427)<br />
Revenues from sales 13,083 29,572 16,776 52 (17,881) 41,602<br />
2 nd quarter 2011<br />
Non-Group sales 5,165 19,089 20,754 1 - 45,009<br />
Intersegment sales 6,341 10,346 158 43 (16,888) -<br />
Excise taxes - (506) (4,038) - - (4,544)<br />
Revenues from sales 11,506 28,929 16,874 44 (16,888) 40,465<br />
3 rd quarter 2011<br />
Non-Group sales 4,770 19,267 22,124 2 - 46,163<br />
Intersegment sales 6,571 11,190 218 45 (18,024) -<br />
Excise taxes - (502) (4,136) - - (4,638)<br />
Revenues from sales 11,341 29,955 18,206 47 (18,024) 41,525<br />
9 months 2011<br />
Non-Group sales 16,079 57,741 63,367 14 - 137,201<br />
Intersegment sales 19,851 32,198 615 129 (52,793) -<br />
Excise taxes - (1,483) (12,126) - - (13,609)<br />
Revenues from sales 35,930 88,456 51,856 143 (52,793) 123,592<br />
Annexe EV - 201209 Conseil d'Administration.docx Page 20 11/2/2012
11) Changes in progress in the Group structure<br />
Upstream<br />
• TOTAL announced in February 2012 the signature of an agreement with Sinochem to sell its interests in<br />
the Cusiana field and in OAM and ODC pipelines. This transaction has been finalised in October 2012.<br />
• TOTAL announced in July 2012 that it has acquired an additional 6% interest in the Ichthys liquefied<br />
natural gas (LNG) project from its partner INPEX. TOTAL’s overall equity stake in the Ichthys LNG project<br />
will grow from 24% to 30%. The transaction remains subject to approval by the relevant authorities.<br />
• <strong>Total</strong> announced in August 2012 the signature of an agreement with INPEX concerning the sale of a<br />
9.99% indirect interest in offshore Angola Block 14. This transaction remains subject to the approval by the<br />
relevant authorities.<br />
Annexe EV - 201209 Conseil d'Administration.docx Page 21 11/2/2012