CONSOLIDATED STATEMENT OF INCOME - Total.com
CONSOLIDATED STATEMENT OF INCOME - Total.com
CONSOLIDATED STATEMENT OF INCOME - Total.com

Create successful ePaper yourself
Turn your PDF publications into a flip-book with our unique Google optimized e-Paper software.
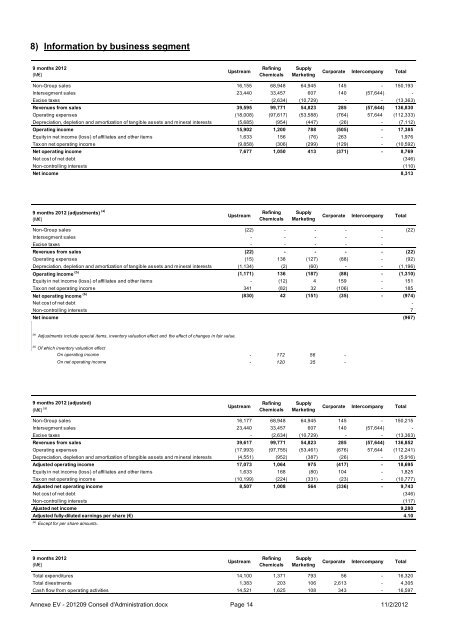
8) Information by business segment<br />
9 months 2012<br />
(M€)<br />
Upstream<br />
Refining<br />
Chemicals<br />
Supply<br />
Marketing<br />
Corporate Inter<strong>com</strong>pany <strong>Total</strong><br />
Non-Group sales 16,155 68,948 64,945 145 - 150,193<br />
Intersegment sales 23,440 33,457 607 140 (57,644) -<br />
Excise taxes - (2,634) (10,729) - - (13,363)<br />
Revenues from sales 39,595 99,771 54,823 285 (57,644) 136,830<br />
Operating expenses (18,008) (97,617) (53,588) (764) 57,644 (112,333)<br />
Depreciation, depletion and amortization of tangible assets and mineral interests (5,685) (954) (447) (26) - (7,112)<br />
Operating in<strong>com</strong>e 15,902 1,200 788 (505) - 17,385<br />
Equity in net in<strong>com</strong>e (loss) of affiliates and other items 1,633 156 (76) 263 - 1,976<br />
Tax on net operating in<strong>com</strong>e (9,858) (306) (299) (129) - (10,592)<br />
Net operating in<strong>com</strong>e 7,677 1,050 413 (371) - 8,769<br />
Net cost of net debt (346)<br />
Non-controlling interests (110)<br />
Net in<strong>com</strong>e 8,313<br />
9 months 2012 (adjustments) (a)<br />
(M€)<br />
Upstream<br />
Refining<br />
Chemicals<br />
Supply<br />
Marketing<br />
Corporate Inter<strong>com</strong>pany <strong>Total</strong><br />
Non-Group sales (22) - - - - (22)<br />
Intersegment sales - - - - -<br />
Excise taxes - - - - -<br />
Revenues from sales (22) - - - - (22)<br />
Operating expenses (15) 138 (127) (88) - (92)<br />
Depreciation, depletion and amortization of tangible assets and mineral interests (1,134) (2) (60) - - (1,196)<br />
Operating in<strong>com</strong>e (b)<br />
(1,171) 136 (187) (88) - (1,310)<br />
Equity in net in<strong>com</strong>e (loss) of affiliates and other items - (12) 4 159 - 151<br />
Tax on net operating in<strong>com</strong>e 341 (82) 32 (106) - 185<br />
Net operating in<strong>com</strong>e (b)<br />
(830) 42 (151) (35) - (974)<br />
Net cost of net debt -<br />
Non-controlling interests 7<br />
Net in<strong>com</strong>e (967)<br />
(a) Adjustments include special items, inventory valuation effect and the effect of changes in fair value.<br />
(b)<br />
Of which inventory valuation effect<br />
On operating in<strong>com</strong>e - 172 56 -<br />
On net operating in<strong>com</strong>e - 120 35 -<br />
(c) Of which equity share of adjustments related to Sanofi-Aventis - - - -<br />
9 months 2012 (adjusted)<br />
(M€) (a)<br />
Upstream<br />
Refining<br />
Chemicals<br />
Supply<br />
Marketing<br />
Corporate Inter<strong>com</strong>pany <strong>Total</strong><br />
Non-Group sales 16,177 68,948 64,945 145 - 150,215<br />
Intersegment sales 23,440 33,457 607 140 (57,644) -<br />
Excise taxes - (2,634) (10,729) - - (13,363)<br />
Revenues from sales 39,617 99,771 54,823 285 (57,644) 136,852<br />
Operating expenses (17,993) (97,755) (53,461) (676) 57,644 (112,241)<br />
Depreciation, depletion and amortization of tangible assets and mineral interests (4,551) (952) (387) (26) - (5,916)<br />
Adjusted operating in<strong>com</strong>e 17,073 1,064 975 (417) - 18,695<br />
Equity in net in<strong>com</strong>e (loss) of affiliates and other items 1,633 168 (80) 104 - 1,825<br />
Tax on net operating in<strong>com</strong>e (10,199) (224) (331) (23) - (10,777)<br />
Adjusted net operating in<strong>com</strong>e 8,507 1,008 564 (336) - 9,743<br />
Net cost of net debt (346)<br />
Non-controlling interests (117)<br />
Ajusted net in<strong>com</strong>e 9,280<br />
Adjusted fully-diluted earnings per share (€) 4.10<br />
(a) Except for per share amounts.<br />
9 months 2012<br />
(M€)<br />
Upstream<br />
Refining<br />
Chemicals<br />
Supply<br />
Marketing<br />
Corporate Inter<strong>com</strong>pany <strong>Total</strong><br />
<strong>Total</strong> expenditures 14,100 1,371 793 56 - 16,320<br />
<strong>Total</strong> divestments 1,383 203 106 2,613 - 4,305<br />
Cash flow from operating activities 14,521 1,625 108 343 - 16,597<br />
Annexe EV - 201209 Conseil d'Administration.docx Page 14 11/2/2012