CONSOLIDATED STATEMENT OF INCOME - Total.com
CONSOLIDATED STATEMENT OF INCOME - Total.com
CONSOLIDATED STATEMENT OF INCOME - Total.com

Create successful ePaper yourself
Turn your PDF publications into a flip-book with our unique Google optimized e-Paper software.
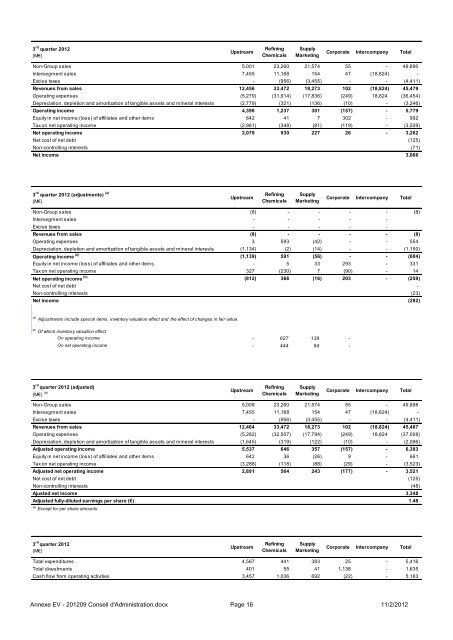
3 rd quarter 2012<br />
(M€)<br />
Upstream<br />
Refining<br />
Chemicals<br />
Supply<br />
Marketing<br />
Corporate Inter<strong>com</strong>pany <strong>Total</strong><br />
Non-Group sales 5,001 23,260 21,574 55 - 49,890<br />
Intersegment sales 7,455 11,168 154 47 (18,824) -<br />
Excise taxes - (956) (3,455) - - (4,411)<br />
Revenues from sales 12,456 33,472 18,273 102 (18,824) 45,479<br />
Operating expenses (5,279) (31,914) (17,836) (249) 18,824 (36,454)<br />
Depreciation, depletion and amortization of tangible assets and mineral interests (2,779) (321) (136) (10) - (3,246)<br />
Operating in<strong>com</strong>e 4,398 1,237 301 (157) - 5,779<br />
Equity in net in<strong>com</strong>e (loss) of affiliates and other items 642 41 7 302 - 992<br />
Tax on net operating in<strong>com</strong>e (2,961) (348) (81) (119) - (3,509)<br />
Net operating in<strong>com</strong>e 2,079 930 227 26 - 3,262<br />
Net cost of net debt (125)<br />
Non-controlling interests (71)<br />
Net in<strong>com</strong>e 3,066<br />
3 rd quarter 2012 (adjustments) (a)<br />
(M€)<br />
Upstream<br />
Refining<br />
Chemicals<br />
Supply<br />
Marketing<br />
Corporate Inter<strong>com</strong>pany <strong>Total</strong><br />
Non-Group sales (8) - - - - (8)<br />
Intersegment sales - - - - -<br />
Excise taxes - - - - -<br />
Revenues from sales (8) - - - - (8)<br />
Operating expenses 3 593 (42) - - 554<br />
Depreciation, depletion and amortization of tangible assets and mineral interests (1,134) (2) (14) - - (1,150)<br />
Operating in<strong>com</strong>e (b)<br />
(1,139) 591 (56) - - (604)<br />
Equity in net in<strong>com</strong>e (loss) of affiliates and other items - 5 33 293 - 331<br />
Tax on net operating in<strong>com</strong>e 327 (230) 7 (90) - 14<br />
Net operating in<strong>com</strong>e (b)<br />
(812) 366 (16) 203 - (259)<br />
Net cost of net debt -<br />
Non-controlling interests (23)<br />
Net in<strong>com</strong>e (282)<br />
(a) Adjustments include special items, inventory valuation effect and the effect of changes in fair value.<br />
(b)<br />
Of which inventory valuation effect<br />
On operating in<strong>com</strong>e - 627 139 -<br />
On net operating in<strong>com</strong>e - 444 94 -<br />
(c) Of which equity share of adjustments related to Sanofi-Aventis - - - -<br />
3 rd quarter 2012 (adjusted)<br />
(M€) (a)<br />
Upstream<br />
Refining<br />
Chemicals<br />
Supply<br />
Marketing<br />
Corporate Inter<strong>com</strong>pany <strong>Total</strong><br />
Non-Group sales 5,009 23,260 21,574 55 - 49,898<br />
Intersegment sales 7,455 11,168 154 47 (18,824) -<br />
Excise taxes - (956) (3,455) - - (4,411)<br />
Revenues from sales 12,464 33,472 18,273 102 (18,824) 45,487<br />
Operating expenses (5,282) (32,507) (17,794) (249) 18,824 (37,008)<br />
Depreciation, depletion and amortization of tangible assets and mineral interests (1,645) (319) (122) (10) - (2,096)<br />
Adjusted operating in<strong>com</strong>e 5,537 646 357 (157) - 6,383<br />
Equity in net in<strong>com</strong>e (loss) of affiliates and other items 642 36 (26) 9 - 661<br />
Tax on net operating in<strong>com</strong>e (3,288) (118) (88) (29) - (3,523)<br />
Adjusted net operating in<strong>com</strong>e 2,891 564 243 (177) - 3,521<br />
Net cost of net debt (125)<br />
Non-controlling interests (48)<br />
Ajusted net in<strong>com</strong>e 3,348<br />
Adjusted fully-diluted earnings per share (€) 1.48<br />
(a) Except for per share amounts.<br />
3 rd quarter 2012<br />
(M€)<br />
Upstream<br />
Refining<br />
Chemicals<br />
Supply<br />
Marketing<br />
Corporate Inter<strong>com</strong>pany <strong>Total</strong><br />
<strong>Total</strong> expenditures 4,567 441 383 25 - 5,416<br />
<strong>Total</strong> divestments 401 55 41 1,138 - 1,635<br />
Cash flow from operating activities 3,457 1,036 692 (22) - 5,163<br />
Annexe EV - 201209 Conseil d'Administration.docx Page 16 11/2/2012