CONSOLIDATED STATEMENT OF INCOME - Total.com
CONSOLIDATED STATEMENT OF INCOME - Total.com
CONSOLIDATED STATEMENT OF INCOME - Total.com

Create successful ePaper yourself
Turn your PDF publications into a flip-book with our unique Google optimized e-Paper software.
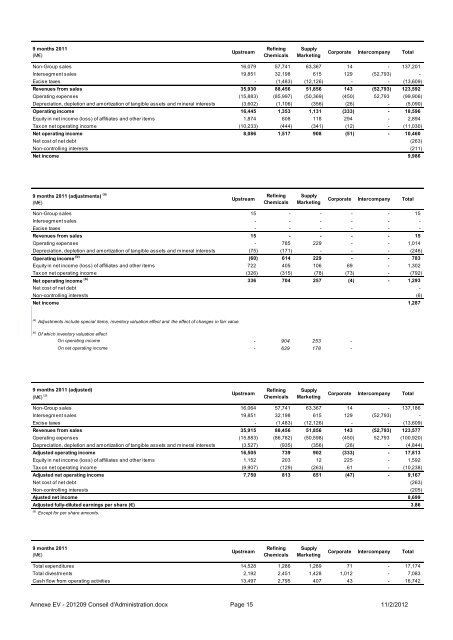
9 months 2011<br />
(M€)<br />
Upstream<br />
Refining<br />
Chemicals<br />
Supply<br />
Marketing<br />
Corporate Inter<strong>com</strong>pany <strong>Total</strong><br />
Non-Group sales 16,079 57,741 63,367 14 - 137,201<br />
Intersegment sales 19,851 32,198 615 129 (52,793) -<br />
Excise taxes - (1,483) (12,126) - - (13,609)<br />
Revenues from sales 35,930 88,456 51,856 143 (52,793) 123,592<br />
Operating expenses (15,883) (85,997) (50,369) (450) 52,793 (99,906)<br />
Depreciation, depletion and amortization of tangible assets and mineral interests (3,602) (1,106) (356) (26) - (5,090)<br />
Operating in<strong>com</strong>e 16,445 1,353 1,131 (333) - 18,596<br />
Equity in net in<strong>com</strong>e (loss) of affiliates and other items 1,874 608 118 294 - 2,894<br />
Tax on net operating in<strong>com</strong>e (10,233) (444) (341) (12) - (11,030)<br />
Net operating in<strong>com</strong>e 8,086 1,517 908 (51) - 10,460<br />
Net cost of net debt (263)<br />
Non-controlling interests (211)<br />
Net in<strong>com</strong>e 9,986<br />
9 months 2011 (adjustments) (a)<br />
(M€)<br />
Upstream<br />
Refining<br />
Chemicals<br />
Supply<br />
Marketing<br />
Corporate Inter<strong>com</strong>pany <strong>Total</strong><br />
Non-Group sales 15 - - - - 15<br />
Intersegment sales - - - - - -<br />
Excise taxes - - - - - -<br />
Revenues from sales 15 - - - - 15<br />
Operating expenses - 785 229 - - 1,014<br />
Depreciation, depletion and amortization of tangible assets and mineral interests (75) (171) - - - (246)<br />
Operating in<strong>com</strong>e (b)<br />
(60) 614 229 - - 783<br />
Equity in net in<strong>com</strong>e (loss) of affiliates and other items 722 405 106 69 - 1,302<br />
Tax on net operating in<strong>com</strong>e (326) (315) (78) (73) - (792)<br />
Net operating in<strong>com</strong>e (b)<br />
336 704 257 (4) - 1,293<br />
Net cost of net debt -<br />
Non-controlling interests (6)<br />
Net in<strong>com</strong>e 1,287<br />
(a) Adjustments include special items, inventory valuation effect and the effect of changes in fair value.<br />
(b)<br />
Of which inventory valuation effect<br />
On operating in<strong>com</strong>e - 904 253 -<br />
On net operating in<strong>com</strong>e - 629 178 -<br />
(c) Of which equity share of adjustments related to Sanofi - - - -<br />
9 months 2011 (adjusted)<br />
(M€) (a)<br />
Upstream<br />
Refining<br />
Chemicals<br />
Supply<br />
Marketing<br />
Corporate Inter<strong>com</strong>pany <strong>Total</strong><br />
Non-Group sales 16,064 57,741 63,367 14 - 137,186<br />
Intersegment sales 19,851 32,198 615 129 (52,793) -<br />
Excise taxes - (1,483) (12,126) - - (13,609)<br />
Revenues from sales 35,915 88,456 51,856 143 (52,793) 123,577<br />
Operating expenses (15,883) (86,782) (50,598) (450) 52,793 (100,920)<br />
Depreciation, depletion and amortization of tangible assets and mineral interests (3,527) (935) (356) (26) - (4,844)<br />
Adjusted operating in<strong>com</strong>e 16,505 739 902 (333) - 17,813<br />
Equity in net in<strong>com</strong>e (loss) of affiliates and other items 1,152 203 12 225 - 1,592<br />
Tax on net operating in<strong>com</strong>e (9,907) (129) (263) 61 - (10,238)<br />
Adjusted net operating in<strong>com</strong>e 7,750 813 651 (47) - 9,167<br />
Net cost of net debt (263)<br />
Non-controlling interests (205)<br />
Ajusted net in<strong>com</strong>e 8,699<br />
Adjusted fully-diluted earnings per share (€) 3.86<br />
(a) Except for per share amounts.<br />
9 months 2011<br />
(M€)<br />
Upstream<br />
Refining<br />
Chemicals<br />
Supply<br />
Marketing<br />
Corporate Inter<strong>com</strong>pany <strong>Total</strong><br />
<strong>Total</strong> expenditures 14,528 1,286 1,289 71 - 17,174<br />
<strong>Total</strong> divestments 2,192 2,451 1,428 1,012 - 7,083<br />
Cash flow from operating activities 13,497 2,795 407 43 - 16,742<br />
Annexe EV - 201209 Conseil d'Administration.docx Page 15 11/2/2012