RETALIX LTD.
RETALIX LTD.
RETALIX LTD.

You also want an ePaper? Increase the reach of your titles
YUMPU automatically turns print PDFs into web optimized ePapers that Google loves.
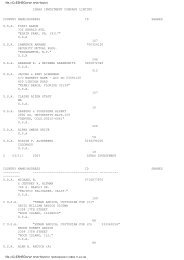
The following table shows the impact of the corrections made and included in the financial statements attached herein on our previously published<br />
quarterly results of operations for the year ended December 31, 2005:<br />
March 31,<br />
2005<br />
The three months period ended<br />
June 30,<br />
3005<br />
Sept'<br />
30, 2005<br />
Dec' 31,<br />
2005<br />
The year<br />
ended The three months period ended<br />
Dec' 31,<br />
2005<br />
March 31,<br />
2005<br />
(in thousands, except per share data)<br />
June 30,<br />
2005<br />
Sept' 30,<br />
2005<br />
Amendments As amended<br />
Dec' 31,<br />
2005<br />
The year<br />
ended<br />
Revenues:<br />
Product sales $(3,824) $(4,304) $(3,922) $(5,179) $(17,229) $16,700 $23,878 $25,288 $25,826 $ 91,692<br />
Services and projects 3,813 1,938 3,136 4,409 13,296 17,102 24,352 26,336 27,889 95,679<br />
Total revenues (11) (2,396) (786) (770) (3,933) 33,802 48,230 51,624 53,715 187,371<br />
Cost of revenues:<br />
Cost of product sales - (2,532) (403) (528) (3,463) 5,765 8,310 8,450 8,996 31,521<br />
Cost of services and<br />
projects - - - 5,298 9,469 9,549 10,149 34,465<br />
Total cost of revenues - (2,532) (403) (528) (3,463) 11,063 17,779 17,999 19,145 65,986<br />
Gross profit (11) 166 (383) (242) (470) 22,739 30,451 33,625 34,570 121,385<br />
Operating expenses:<br />
Research and development<br />
expenses-net - - 8,437 11,973 12,188 12,085 44,683<br />
Selling and marketing<br />
expenses - - 6,770 8,995 9,191 8,426 33,382<br />
General and<br />
administrative expenses . - - (67) 334 267 4,378 6,371 6,372 6,010 23,131<br />
Other general income<br />
(expenses) - net - - 83 83 - - (6) 6 -<br />
Total operating expenses - - 16 334 350 19,585 27,339 27,745 26,527 101,196<br />
Income from operations (11) 166 (399) (576) (820) 3,154 3,112 5,880 8,043 20,189<br />
Financial income<br />
(expenses) - net - - 174 (161) 63 126 202<br />
Gain arising from issuance<br />
of shares by a<br />
subsidiary and an<br />
associated company - - 83 83 - - 83 83<br />
Income before taxes on<br />
income (11) 166 (316) (576) (737) 3,328 2,951 6,026 8,169 20,474<br />
Taxes on income (2) 44 (81) 167 128 993 514 1,772 2,633 5,912<br />
Income after taxes on<br />
income (9) 122 (235) (743) (865) 2,335 2,437 4,254 5,536 14,562<br />
Share in losses of an<br />
associated company - - (40) (43) (20) (27) (130)<br />
Minority interests in<br />
losses of subsidiaries - - 72 134 (44) 27 189<br />
Net income $ (9) $ 122 $ (235) $ (743) $ (865) $ 2,367 $ 2,528 $ 4,190 $ 5,536 $ 14,621<br />
Earnings per share:<br />
Basic - $ 0.01 $ (0.01) $ (0.04) $ (0.04) $ 0.13 $ 0.14 $ 0.22 $ 0.29 $ 0.78<br />
Diluted - $ 0.01 $ (0.01) $ (0.04) $ (0.04) $ 0.13 $ 0.13 $ 0.21 $ 0.28 $ 0.74<br />
Dec' 31,<br />
2005