RETALIX LTD.
RETALIX LTD.
RETALIX LTD.

Create successful ePaper yourself
Turn your PDF publications into a flip-book with our unique Google optimized e-Paper software.
ITEM 3 – KEY INFORMATION<br />
A. Selected Financial Data<br />
The selected consolidated statement of income data set forth below with respect to the years ended December 31, 2001, 2002, 2003 and 2004 and the<br />
selected consolidated balance sheet data as of December 31, 2001, 2002, 2003 and 2004 set forth below have been derived from our consolidated financial<br />
statements that were audited by Kesselman & Kesselman, a member of PricewaterhouseCoopers International Limited. The selected consolidated<br />
statement of income data set forth below with respect to the year ended December 31, 2005 and the selected consolidated balance sheet data as of<br />
December 31, 2005 set forth below have been derived from our consolidated financial statements that were audited by Kost, Forer, Gabbay & Kasierer, a<br />
member of Ernst & Young Global. The selected consolidated financial data set forth below should be read in conjunction with “Item 5 -- Operating and<br />
Financial Review and Prospects” and our consolidated financial statements and notes to those statements for the years 2003, 2004 and 2005 included<br />
elsewhere in this annual report. Historical results are not necessarily indicative of the results to be expected in the future.<br />
6<br />
Year ended December 31,<br />
2001 2002 2003 2004 2005<br />
(in thousands, except share and per share data)<br />
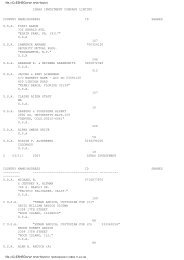
Consolidated statement of income data<br />
Revenues:<br />
Product sales $ 34,333 $ 47,280 $ 58,432 $ 77,494 $ 91,692<br />
Services and projects 24,953 29,173 33,625 45,460 95,679<br />
Total revenues 59,286 76,453 92,057 122,954 187,371<br />
Cost of revenues:<br />
Cost of product sales 7,135 11,970 16,576 23,246 31,521<br />
Cost of services and projects 8,781 10,141 12,440 18,890 34,465<br />
Total cost of revenues 15,916 22,111 29,016 42,136 65,986<br />
Gross profit 43,370 54,342 63,041 80,818 121,385<br />
Operating expenses:<br />
Research and development expenses-net 14,571 17,036 18,344 34,096 44,683<br />
Selling and marketing expenses 14,506 18,111 21,542 24,798 33,382<br />
General and administrative expenses 12,017 12,455 13,345 15,944 23,131<br />
Other general income (expenses) – net 17 1,043 (62) 15<br />
Total operating expenses 41,077 46,559 53,293 74,823 101,196<br />
Income from operations 2,293 7,783 9,748 5,995 20,189<br />
Financial income (expenses)-net (365) (499) (95) 85 202<br />
Gain arising from issuance of shares by a subsidiary and an<br />
associated company 2,877 – 1,068 200 83<br />
Other expenses (501) – – – –<br />
Income before taxes on income 4,304 7,284 10,721 6,280 20,474<br />
Taxes on income 706 2,103 2,639 1,553 5,912<br />
Share in losses of an associated company – – (90) (137) (130)<br />
Minority interests in losses of subsidiaries 166 524 288 247 189<br />
Net income $ 3,764 $ 5,705 $ 8,280 $ 4,837 $ 14,621<br />
Earnings per share:<br />
Basic $ 0.33 $ 0.48 $ 0.67 $ 0.31 $ 0.78<br />
Diluted $ 0.31 $ 0.46 $ 0.63 $ 0.29 $ 0.74<br />
Weighted average number of shares used in computation:<br />
Basic 11,472 11,902 12,323 15,746 18,710<br />
Diluted 12,153 12,395 13,083 16,552 19,659