tidal hardwood swamps - Maryland Department of Natural Resources
tidal hardwood swamps - Maryland Department of Natural Resources
tidal hardwood swamps - Maryland Department of Natural Resources

You also want an ePaper? Increase the reach of your titles
YUMPU automatically turns print PDFs into web optimized ePapers that Google loves.
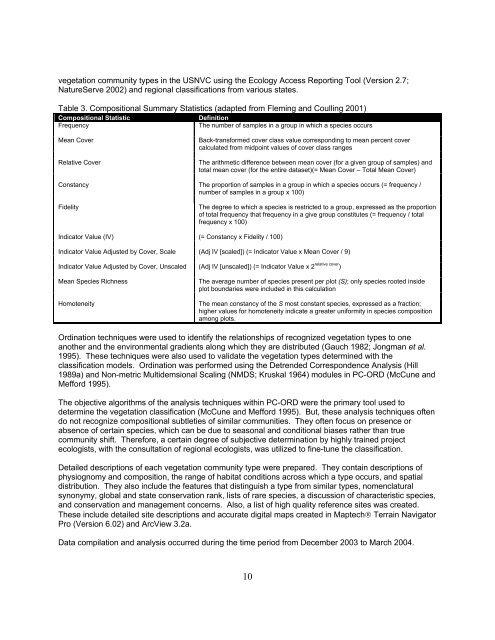
vegetation community types in the USNVC using the Ecology Access Reporting Tool (Version 2.7;<br />
NatureServe 2002) and regional classifications from various states.<br />
Table 3. Compositional Summary Statistics (adapted from Fleming and Coulling 2001)<br />
Compositional Statistic Definition<br />
Frequency The number <strong>of</strong> samples in a group in which a species occurs<br />
Mean Cover Back-transformed cover class value corresponding to mean percent cover<br />
calculated from midpoint values <strong>of</strong> cover class ranges<br />
Relative Cover The arithmetic difference between mean cover (for a given group <strong>of</strong> samples) and<br />
total mean cover (for the entire dataset)(= Mean Cover – Total Mean Cover)<br />
Constancy The proportion <strong>of</strong> samples in a group in which a species occurs (= frequency /<br />
number <strong>of</strong> samples in a group x 100)<br />
Fidelity The degree to which a species is restricted to a group, expressed as the proportion<br />
<strong>of</strong> total frequency that frequency in a give group constitutes (= frequency / total<br />
frequency x 100)<br />
Indicator Value (IV) (= Constancy x Fidelity / 100)<br />
Indicator Value Adjusted by Cover, Scale (Adj IV [scaled]) (= Indicator Value x Mean Cover / 9)<br />
Indicator Value Adjusted by Cover, Unscaled (Adj IV [unscaled]) (= Indicator Value x 2 relative cover )<br />
Mean Species Richness The average number <strong>of</strong> species present per plot (S); only species rooted inside<br />
plot boundaries were included in this calculation<br />
Homoteneity The mean constancy <strong>of</strong> the S most constant species, expressed as a fraction;<br />
higher values for homoteneity indicate a greater uniformity in species composition<br />
among plots.<br />
Ordination techniques were used to identify the relationships <strong>of</strong> recognized vegetation types to one<br />
another and the environmental gradients along which they are distributed (Gauch 1982; Jongman et al.<br />
1995). These techniques were also used to validate the vegetation types determined with the<br />
classification models. Ordination was performed using the Detrended Correspondence Analysis (Hill<br />
1989a) and Non-metric Multidemsional Scaling (NMDS; Kruskal 1964) modules in PC-ORD (McCune and<br />
Mefford 1995).<br />
The objective algorithms <strong>of</strong> the analysis techniques within PC-ORD were the primary tool used to<br />
determine the vegetation classification (McCune and Mefford 1995). But, these analysis techniques <strong>of</strong>ten<br />
do not recognize compositional subtleties <strong>of</strong> similar communities. They <strong>of</strong>ten focus on presence or<br />
absence <strong>of</strong> certain species, which can be due to seasonal and conditional biases rather than true<br />
community shift. Therefore, a certain degree <strong>of</strong> subjective determination by highly trained project<br />
ecologists, with the consultation <strong>of</strong> regional ecologists, was utilized to fine-tune the classification.<br />
Detailed descriptions <strong>of</strong> each vegetation community type were prepared. They contain descriptions <strong>of</strong><br />
physiognomy and composition, the range <strong>of</strong> habitat conditions across which a type occurs, and spatial<br />
distribution. They also include the features that distinguish a type from similar types, nomenclatural<br />
synonymy, global and state conservation rank, lists <strong>of</strong> rare species, a discussion <strong>of</strong> characteristic species,<br />
and conservation and management concerns. Also, a list <strong>of</strong> high quality reference sites was created.<br />
These include detailed site descriptions and accurate digital maps created in Maptech® Terrain Navigator<br />
Pro (Version 6.02) and ArcView 3.2a.<br />
Data compilation and analysis occurred during the time period from December 2003 to March 2004.<br />
10