CONTRIBUTION TO CINCHONA ALKALOIDS CHEMISTRY
CONTRIBUTION TO CINCHONA ALKALOIDS CHEMISTRY
CONTRIBUTION TO CINCHONA ALKALOIDS CHEMISTRY

Create successful ePaper yourself
Turn your PDF publications into a flip-book with our unique Google optimized e-Paper software.
Ph.D. Thesis Abstract Contribution to cinchona alkaloids chemistry<br />
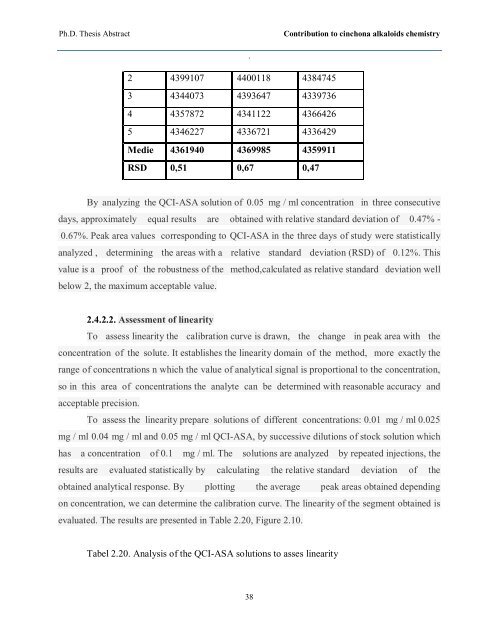
2 4399107 4400118 4384745<br />
3 4344073 4393647 4339736<br />
4 4357872 4341122 4366426<br />
5 4346227 4336721 4336429<br />
Medie 4361940 4369985 4359911<br />
RSD 0,51 0,67 0,47<br />
.<br />
By analyzing the QCI-ASA solution of 0.05 mg / ml concentration in three consecutive<br />
days, approximately equal results are obtained with relative standard deviation of 0.47% -<br />
0.67%. Peak area values corresponding to QCI-ASA in the three days of study were statistically<br />
analyzed , determining the areas with a relative standard deviation (RSD) of 0.12%. This<br />
value is a proof of the robustness of the method,calculated as relative standard deviation well<br />
below 2, the maximum acceptable value.<br />
2.4.2.2. Assessment of linearity<br />
To assess linearity the calibration curve is drawn, the change in peak area with the<br />
concentration of the solute. It establishes the linearity domain of the method, more exactly the<br />
range of concentrations n which the value of analytical signal is proportional to the concentration,<br />
so in this area of concentrations the analyte can be determined with reasonable accuracy and<br />
acceptable precision.<br />
To assess the linearity prepare solutions of different concentrations: 0.01 mg / ml 0.025<br />
mg / ml 0.04 mg / ml and 0.05 mg / ml QCI-ASA, by successive dilutions of stock solution which<br />
has a concentration of 0.1 mg / ml. The solutions are analyzed by repeated injections, the<br />
results are evaluated statistically by calculating the relative standard deviation of the<br />
obtained analytical response. By plotting the average peak areas obtained depending<br />
on concentration, we can determine the calibration curve. The linearity of the segment obtained is<br />
evaluated. The results are presented in Table 2.20, Figure 2.10.<br />
Tabel 2.20. Analysis of the QCI-ASA solutions to asses linearity<br />
38