fFILE COPY
fFILE COPY
fFILE COPY

You also want an ePaper? Increase the reach of your titles
YUMPU automatically turns print PDFs into web optimized ePapers that Google loves.
®<br />
http://legacy.library.ucsf.edu/tid/fpe59c00/pdf<br />
VOLUME LOADING EiTECrS ON THE HEART USING "P NMR 145<br />
series of pulses of diH'erent dumsion'(15-50 us) was applied and spectra were acquired<br />
with a delay time of 4 s. The pulse width which provided the best signal/noise for PCr<br />
and ATP was used for radiofiepuency stimulation for each expnimmt . Opttlmat pulses<br />
were between 35 and 30 µs .<br />
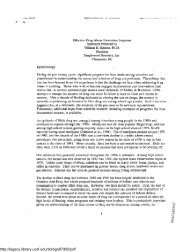
The schematic repraenlation of pla,ccment of the 1-cm-diameter surface cail on<br />
the heart is shown in Frg 1 . Practically a)1 the NMR signal cantributing to the spectrum<br />
was generated from the indicated sensitive region . which extends from the heae sullhtt<br />
by 4 mm into the myocardium and is roughly ellipsoidally shaped with a diameter<br />
varying from 12 to 13 mm . These data were generated by integrating over the threedimensional<br />
modulation profile of a suPface coil, BI x sie(ryBJ . 8ased on this infor<br />
mation, we do not expect an appreciabfe amount of contamination of the muscle<br />
spectrum from blood within the ventricle.<br />
t1P NMR spectra were obtained using respiratory and electrocardiographic gating .<br />
To do this , the following procedure was used . The respirator was outfened with a<br />
switch which was turned on at end expiration . Respiratory informarion along with<br />
ECG signal was fed into a uiggering lrox . (built in our lab) . The first QRS. on the ECG,<br />
observed by the sensing device in the triggering box. after end expimtion was used to<br />
trigger the mdiofrequertcy pulse for NMR spectra acquisition . Each spectrum consisted<br />
of 100 seans obtained with a delay tiine of 4 s(based on preset respiration rate main•<br />
tained by the ventilator) and an NMR acquisition time of 200 ms per wan, for a total<br />
time per spectrum of approximarely 6 min .<br />
Since the TI's for PCr. d-ATP, and P, are approximately 4. 1 .5 . and 1 . S s. respectively<br />
(26), saturation e&cts wnuid result from using a delay time of 4 s . However. using<br />
longer delay times would make data collection times inordinately long . Therefore.<br />
MY[e aqe<br />
qe~<br />
C~CM Yt~Yn r, NrO .~<br />
fuYm M<br />
.aep.M1 n,rpr .<br />
F•lo . 1 . Cwn•stcuond diatram of tulfatt eui7 placement an the heart weh a pmale urUhe eendti .