fFILE COPY
fFILE COPY
fFILE COPY

Create successful ePaper yourself
Turn your PDF publications into a flip-book with our unique Google optimized e-Paper software.
®<br />
http://legacy.library.ucsf.edu/tid/fpe59c00/pdf<br />
146 oSBAKKEN ET AL .<br />
sereral sets of experiments were performed to determine the etfects of saturation .<br />
Delay times (TR time) of 4, 8 . 12 . 16. and 20 s were used . No change in signal/noise<br />
occurred for ATP or P, with a TR time of 4 s or greater . The PCr siplal increased<br />
progressively up to a TR time of 16 s(16% incpease from a 4 f TR time), with no<br />
funher increase in PCr signal with longer TR times . Since only one p:ak, the PCr<br />
peak, would experience saturation effecu and because we were osing taYeo data and<br />
not pertonning absolute quantification, we chose not to apply a correction /atctor for<br />
saturation to our data .<br />
The Pmblinn uf glotd ?.3J)ipposphughar~dre<br />
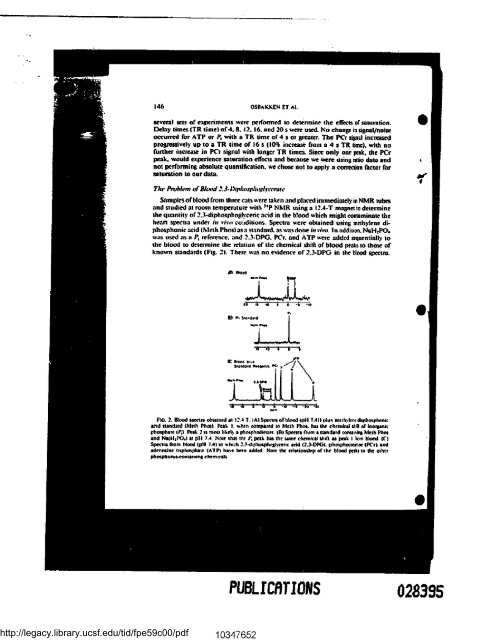
Samples otblood from three cats were taken and placed immediately in NMR tubes<br />
and studied at room remperature with 1aP NMR using a 12 .4-T magnet to determine<br />
the quantity of 2 .3-diphosphoglrceric acid in the btood which might contaminate the<br />
heart spectm under in rnn co:n3itions . Spectra wers obtained using melhylene diphosphonic<br />
acid (Meth Phos) as a standard. as wasdodie in trro. Inaddition. NaH2P0s<br />
was used as a P, reference . and 2 .3-DPG. PCr. and ATP were added sequentially to<br />
the blood to determine the relation or the chemical shi/t of blood peaks to those of<br />
known standards (Fig. 2). There was no evidence of 2•3•DPG in the blood spectra.<br />
B n. S~sbo•n<br />
.n. .+w<br />
C n~em n~.r N1<br />
froneem btt•^t . K' e// ~<br />
rw.r t .e¢ota<br />
~ tla.<br />
II I a<br />
Fq. 2. B1ood fm