The Discontinuous Conduction Mode Sepic and ´ Cuk Power
The Discontinuous Conduction Mode Sepic and ´ Cuk Power
The Discontinuous Conduction Mode Sepic and ´ Cuk Power

You also want an ePaper? Increase the reach of your titles
YUMPU automatically turns print PDFs into web optimized ePapers that Google loves.
634 IEEE TRANSACTIONS ON INDUSTRIAL ELECTRONICS, VOL. 44, NO. 5, OCTOBER 1997<br />
(a) (b)<br />
(c) (d)<br />
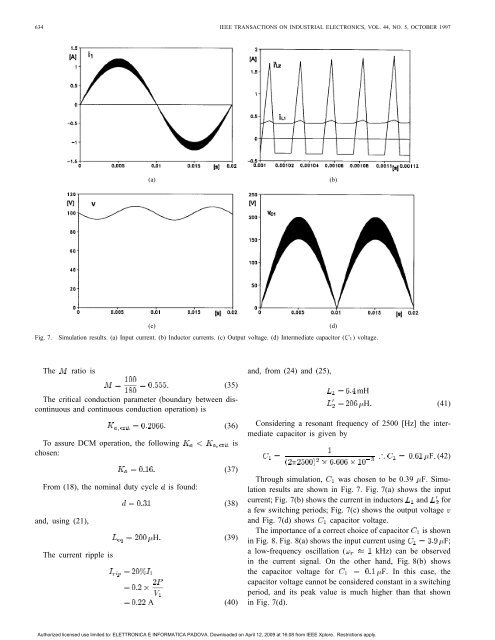
Fig. 7. Simulation results. (a) Input current. (b) Inductor currents. (c) Output voltage. (d) Intermediate capacitor (gI) voltage.<br />
<strong>The</strong> ratio is<br />
(35)<br />
<strong>The</strong> critical conduction parameter (boundary between discontinuous<br />
<strong>and</strong> continuous conduction operation) is<br />
(36)<br />
To assure DCM operation, the following is<br />
chosen:<br />
From (18), the nominal duty cycle is found:<br />
<strong>and</strong>, using (21),<br />
<strong>The</strong> current ripple is<br />
(37)<br />
(38)<br />
H (39)<br />
A (40)<br />
<strong>and</strong>, from (24) <strong>and</strong> (25),<br />
mH<br />
H (41)<br />
Considering a resonant frequency of 2500 [Hz] the intermediate<br />
capacitor is given by<br />
F (42)<br />
Through simulation, was chosen to be 0.39 F. Simulation<br />
results are shown in Fig. 7. Fig. 7(a) shows the input<br />
current; Fig. 7(b) shows the current in inductors <strong>and</strong> for<br />
a few switching periods; Fig. 7(c) shows the output voltage<br />
<strong>and</strong> Fig. 7(d) shows capacitor voltage.<br />
<strong>The</strong> importance of a correct choice of capacitor is shown<br />
in Fig. 8. Fig. 8(a) shows the input current using F;<br />
a low-frequency oscillation ( kHz) can be observed<br />
in the current signal. On the other h<strong>and</strong>, Fig. 8(b) shows<br />
the capacitor voltage for F. In this case, the<br />
capacitor voltage cannot be considered constant in a switching<br />
period, <strong>and</strong> its peak value is much higher than that shown<br />
in Fig. 7(d).<br />
Authorized licensed use limited to: ELETTRONICA E INFORMATICA PADOVA. Downloaded on April 12, 2009 at 16:08 from IEEE Xplore. Restrictions apply.