A Novel Method for Determination of Paraffin Wax Content ... - Nynas
A Novel Method for Determination of Paraffin Wax Content ... - Nynas
A Novel Method for Determination of Paraffin Wax Content ... - Nynas

Create successful ePaper yourself
Turn your PDF publications into a flip-book with our unique Google optimized e-Paper software.
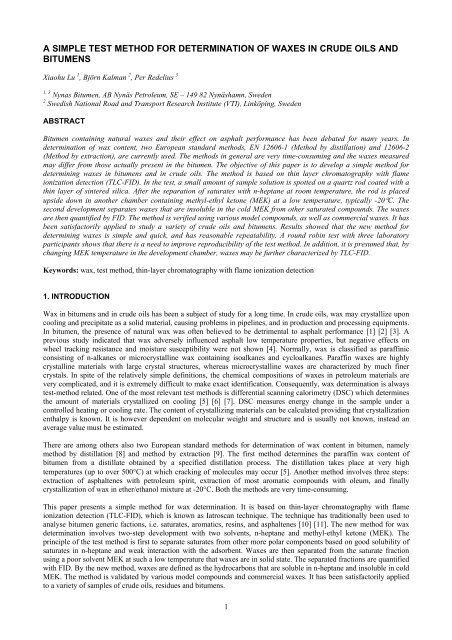
A SIMPLE TEST METHOD FOR DETERMINATION OF WAXES IN CRUDE OILS AND<br />
BITUMENS<br />
Xiaohu Lu 1 , Björn Kalman 2 , Per Redelius 3<br />
1, 3 <strong>Nynas</strong> Bitumen, AB Nynäs Petroleum, SE – 149 82 Nynäshamn, Sweden<br />
2 Swedish National Road and Transport Research Institute (VTI), Linköping, Sweden<br />
ABSTRACT<br />
Bitumen containing natural waxes and their effect on asphalt per<strong>for</strong>mance has been debated <strong>for</strong> many years. In<br />
determination <strong>of</strong> wax content, two European standard methods, EN 12606-1 (<strong>Method</strong> by distillation) and 12606-2<br />
(<strong>Method</strong> by extraction), are currently used. The methods in general are very time-consuming and the waxes measured<br />
may differ from those actually present in the bitumen. The objective <strong>of</strong> this paper is to develop a simple method <strong>for</strong><br />
determining waxes in bitumens and in crude oils. The method is based on thin layer chromatography with flame<br />
ionization detection (TLC-FID). In the test, a small amount <strong>of</strong> sample solution is spotted on a quartz rod coated with a<br />
thin layer <strong>of</strong> sintered silica. After the separation <strong>of</strong> saturates with n-heptane at room temperature, the rod is placed<br />
upside down in another chamber containing methyl-ethyl ketone (MEK) at a low temperature, typically -20°C. The<br />
second development separates waxes that are insoluble in the cold MEK from other saturated compounds. The waxes<br />
are then quantified by FID. The method is verified using various model compounds, as well as commercial waxes. It has<br />
been satisfactorily applied to study a variety <strong>of</strong> crude oils and bitumens. Results showed that the new method <strong>for</strong><br />
determining waxes is simple and quick, and has reasonable repeatability. A round robin test with three laboratory<br />
participants shows that there is a need to improve reproducibility <strong>of</strong> the test method. In addition, it is presumed that, by<br />
changing MEK temperature in the development chamber, waxes may be further characterized by TLC-FID.<br />
Keywords: wax, test method, thin-layer chromatography with flame ionization detection<br />
1. INTRODUCTION<br />
<strong>Wax</strong> in bitumens and in crude oils has been a subject <strong>of</strong> study <strong>for</strong> a long time. In crude oils, wax may crystallize upon<br />
cooling and precipitate as a solid material, causing problems in pipelines, and in production and processing equipments.<br />
In bitumen, the presence <strong>of</strong> natural wax was <strong>of</strong>ten believed to be detrimental to asphalt per<strong>for</strong>mance [1] [2] [3]. A<br />
previous study indicated that wax adversely influenced asphalt low temperature properties, but negative effects on<br />
wheel tracking resistance and moisture susceptibility were not shown [4]. Normally, wax is classified as paraffinic<br />
consisting <strong>of</strong> n-alkanes or microcrystalline wax containing isoalkanes and cycloalkanes. <strong>Paraffin</strong> waxes are highly<br />
crystalline materials with large crystal structures, whereas microcrystalline waxes are characterized by much finer<br />
crystals. In spite <strong>of</strong> the relatively simple definitions, the chemical compositions <strong>of</strong> waxes in petroleum materials are<br />
very complicated, and it is extremely difficult to make exact identification. Consequently, wax determination is always<br />
test-method related. One <strong>of</strong> the most relevant test methods is differential scanning calorimetry (DSC) which determines<br />
the amount <strong>of</strong> materials crystallized on cooling [5] [6] [7]. DSC measures energy change in the sample under a<br />
controlled heating or cooling rate. The content <strong>of</strong> crystallizing materials can be calculated providing that crystallization<br />
enthalpy is known. It is however dependent on molecular weight and structure and is usually not known, instead an<br />
average value must be estimated.<br />
There are among others also two European standard methods <strong>for</strong> determination <strong>of</strong> wax content in bitumen, namely<br />
method by distillation [8] and method by extraction [9]. The first method determines the paraffin wax content <strong>of</strong><br />
bitumen from a distillate obtained by a specified distillation process. The distillation takes place at very high<br />
temperatures (up to over 500°C) at which cracking <strong>of</strong> molecules may occur [5]. Another method involves three steps:<br />
extraction <strong>of</strong> asphaltenes with petroleum spirit, extraction <strong>of</strong> most aromatic compounds with oleum, and finally<br />
crystallization <strong>of</strong> wax in ether/ethanol mixture at -20°C. Both the methods are very time-consuming.<br />
This paper presents a simple method <strong>for</strong> wax determination. It is based on thin-layer chromatography with flame<br />
ionization detection (TLC-FID), which is known as Iatroscan technique. The technique has traditionally been used to<br />
analyse bitumen generic factions, i.e. saturates, aromatics, resins, and asphaltenes [10] [11]. The new method <strong>for</strong> wax<br />
determination involves two-step development with two solvents, n-heptane and methyl-ethyl ketone (MEK). The<br />
principle <strong>of</strong> the test method is first to separate saturates from other more polar components based on good solubility <strong>of</strong><br />
saturates in n-heptane and weak interaction with the adsorbent. <strong>Wax</strong>es are then separated from the saturate fraction<br />
using a poor solvent MEK at such a low temperature that waxes are in solid state. The separated fractions are quantified<br />
with FID. By the new method, waxes are defined as the hydrocarbons that are soluble in n-heptane and insoluble in cold<br />
MEK. The method is validated by various model compounds and commercial waxes. It has been satisfactorily applied<br />
to a variety <strong>of</strong> samples <strong>of</strong> crude oils, residues and bitumens.<br />
1
2. MATERIALS<br />
Model compounds: A series <strong>of</strong> n-alkanes from n-hexadecane (n-C16) to n-hexatriacontane (n-C36) and an isoalkane<br />
squalane (C30H62) were selected <strong>for</strong> method validation. All the model compounds are <strong>of</strong> synthesis grade, and their<br />
melting points range from 18°C <strong>for</strong> n-C16 to 76.5°C <strong>for</strong> n-C36.<br />
Commercial waxes: A number <strong>of</strong> refined waxes were selected. The commercial waxes were branded either as<br />
microcrystalline or paraffinic by respective producers. In Table 1, in<strong>for</strong>mation provided by the producers is shown.<br />
Compared with the paraffinic waxes, the microcrystalline samples have higher melting points (MP, ASTM D 127) or<br />
congealing points (CP, ASTM D 938), indicating their molecular weight is considerably larger than the paraffinic<br />
waxes. The selected samples also included slack wax, a by-product <strong>of</strong> the de-waxing process <strong>of</strong> lubricating oil.<br />
Source Brand name Type CP or MP, °C<br />
Sasol <strong>Wax</strong><br />
Sasolwax 5805 <strong>Paraffin</strong> 58−60 (CP)<br />
Sasolwax 5604 <strong>Paraffin</strong> 55−57 (CP)<br />
Sasolwax 5891 Microcrystalline 70−75 (CP)<br />
Sasolwax 0907 Microcrystalline 83−94 (CP)<br />
Strahl & Pitsch<br />
SP 173P <strong>Paraffin</strong> 61 (MP)<br />
SP 19 Microcrystalline 81 (MP)<br />
SP 60 Microcrystalline 82 (MP)<br />
Hans-Otto Schumann<br />
GmbH& Co<br />
Terhell paraffin JA 201 Slack wax 42.5 (CP)<br />
Table 1: Characteristics <strong>of</strong> commercial waxes<br />
Crude oils and residues: Three crude oils <strong>of</strong> Venezuelan (Boscan) or Russian source and their residue were chosen<br />
(Table 2). Residue is obtained as a bottom fraction in a distillation process which separates crude oils into fractions by<br />
selective boiling points. It consists <strong>of</strong> the least volatile components at a specific boiling point (cut point). The cut points<br />
used <strong>for</strong> the three residues were 400°C <strong>for</strong> Boscan, 555°C <strong>for</strong> Russian A, and 560°C <strong>for</strong> Russian B. The yields<br />
determined by a simulated distillation using high temperature gas chromatography (HTGC) were estimated to 80% <strong>for</strong><br />
Boscan crude oil, 22% <strong>for</strong> Russian A crude oil, and 15% <strong>for</strong> Russian B crude oil. Compared with the Boscan crude oil,<br />
the Russian crude oils are more paraffnic and contain more light fractions. The crude oils and residues were further<br />
characterized using a DSC procedure described in [5], and results are shown in Table 2.<br />
DSC parameters<br />
Venezuelan (Boscan) Russian A Russian B<br />
Crude oil Residue Crude oil Residue Crude oil Residue<br />
Crystal. onset, °C 26.1 27.6 22.6 36.8 28.0 48.0<br />
Melting out temp., °C 71.3 55.0 46.5 84.5 44.0 98.3<br />
<strong>Wax</strong> content, % 4.1 0.4 12.2 2.1 9.4 4.8<br />
Table 2: DSC analysis <strong>of</strong> crude oils and corresponding residues<br />
Bitumens: Six samples <strong>of</strong> different sources and <strong>of</strong> different wax contents were selected. The bitumens are 70/100 or<br />
160/220 pen grade. Typical parameters <strong>of</strong> the bitumen samples are shown in Table 3.<br />
Bitumen Source Penetration,<br />
dmm<br />
Bit-A Venezuela 192<br />
Bit-B Venezuela 214<br />
Bit-C Middle East 205<br />
Bit-D Russia 180<br />
Bit-E Mexico 101<br />
Bit-F Unknown 86<br />
Table 3: Bitumen samples<br />
S<strong>of</strong>tening<br />
point, °C<br />
37.8<br />
39.1<br />
39.2<br />
40.1<br />
45.1<br />
46.4<br />
2<br />
Vis. 135°C, <strong>Wax</strong> content, %<br />
mm 2 /s EN 12606-1 DSC<br />
199<br />
0.4<br />
0<br />
283<br />
1.1<br />
2.4<br />
225<br />
1.3<br />
4.2<br />
202<br />
1.5<br />
4.1<br />
325<br />
1.2<br />
4.1<br />
181<br />
1.7<br />
6.2
3. TLC-FID PROCEDURE<br />
The TLC/FID system used was Iatroscan TH-10 TLC/FID analyser MK-4. Quartz rods (Chromarod, 10 in a rod holder)<br />
coated with a thin layer <strong>of</strong> silica were used <strong>for</strong> fraction separation. FID signals were collected and amplified in an inhouse<br />
assembled amplifier. Data were analyzed using s<strong>of</strong>tware Spectrum Viewer Basic 2.6. Peaks in the<br />
chromatograms were quantified by the area above a horizontal baseline drawn from one side <strong>of</strong> the peak to the other<br />
side or extrapolated from a distinct baseline in the chromatogram.<br />
The principle <strong>of</strong> the TLC procedure <strong>for</strong> wax separation is illustrated in Figure 1. First, a sample solution (1% w/v) is<br />
prepared with chloro<strong>for</strong>m and 1 µL <strong>of</strong> this solution is spotted near the bottom <strong>of</strong> a rod. After evaporation <strong>of</strong> chloro<strong>for</strong>m<br />
at ambient condition, the rod in a frame is placed in a lined development chamber containing n-heptane and only the<br />
very bottom <strong>of</strong> the rod is in contact with the solvent (solvent should not contact the sample spot). The rod is then<br />
developed <strong>for</strong> 35 minutes when n-heptane slowly rises up on the rod by capillary action. Due to good solubility in nheptane<br />
and weak interaction with the adsorbent (silica), saturates are carried farther up, thus separated from other more<br />
polar components, which mainly stays at the application point.<br />
After drying, the rod is turned upside down and hung inside the second development chamber containing MEK. This<br />
development tank is kept in a freezer or climatic chamber at a low temperature, <strong>for</strong> example -20°C. During temperature<br />
equilibrium, the rod is not in contact with MEK. After ten minutes, the rod (still upside down) is lowered into contact<br />
with solvent MEK and elution is proceeded <strong>for</strong> 25 minutes. During this step, some saturates move with MEK front,<br />
while solid waxes stay and are separated because <strong>of</strong> low solubility in MEK.<br />
After the development in MEK, the rod, still in the frame, is left to dry at ambient condition <strong>for</strong> 40 minutes prior to FID<br />
analysis. The long drying time is necessary because water can condensate on the rod when it is transferred from the<br />
freezer into the ambient temperature. To remove traces <strong>of</strong> water, the rod is finally dried <strong>for</strong> about 2 minutes in an oven<br />
at 80°C.<br />
Spotting sample<br />
on a Chromarod<br />
Saturates<br />
upside upside down<br />
down<br />
Non-saturate<br />
fraction<br />
In n-heptane chamber<br />
at ambient temperature<br />
Non-saturate<br />
fraction<br />
Saturates<br />
Figure 1: Principle <strong>of</strong> wax separation by thin-layer chromatography (TLC)<br />
4. RESULTS AND DISCUSSION<br />
4.1 Verification with model compounds<br />
Non-saturate<br />
fraction<br />
Other saturates<br />
<strong>Wax</strong>es<br />
In MEK chamber<br />
at a low temperature<br />
In the first development step with n-heptane, it is generally agreed that the saturate fraction moves with the solvent<br />
front. In the second step, by selecting a proper low temperature <strong>for</strong> MEK, it is assumed that solid waxes will stick to the<br />
rod while other saturates move with the MEK front. To verify the above hypothesis, we used various model compounds<br />
which are typical <strong>of</strong> materials known to crystallize if present in crude oils and bitumens. Those included a series <strong>of</strong> nalkanes,<br />
such as n-hexadecane (n-C16), n-eicosane (n-C20), n-tetracosane (n-C24), n-octacosane (n-C28), and nhexatriacontane<br />
(n-C36). As a reference <strong>for</strong> a material known not to crystallize, squalane (2,6,10,15,19,23-hexamethyltetracosane)<br />
was also selected. As expected, in n-heptane at ambient temperature, all these compounds moved with the<br />
solvent front.<br />
3
In MEK, experiments were made at temperatures varied in steps <strong>of</strong> 5°C from -40°C to 20°C. Examples <strong>of</strong><br />
chromatogram at different temperatures are shown <strong>for</strong> n-C20 in Figure 2. This compound is practically stationary at the<br />
spotting site when temperature is -20°C, whereas at -5°C, it <strong>for</strong>ms a large hump after the solvent front. Observations <strong>for</strong><br />
other n-alkanes are summarized in Table 4. For the n-alkanes <strong>of</strong> larger size, the critical MEK temperature <strong>for</strong><br />
immobilizing n-alkane is higher. In case <strong>of</strong> n-C36, such temperatures are higher than 20°C. The dependency <strong>of</strong> the<br />
critical MEK temperature upon n-alkanes is further illustrated by an excellent relationship to the melting point <strong>of</strong> nalkane<br />
in Figure 3. The critical MEK temperatures are found to be approximately 58°C lower than the melting points <strong>of</strong><br />
n-alkanes. As <strong>for</strong> squalane, movement with the MEK front can be seen at temperature as low as -40°C. This substance<br />
has the same carbon number as n-C30, but its melting point is -38°C, which is 104°C lower than that <strong>of</strong> n-C30. If the<br />
correlation shown <strong>for</strong> n-alkanes also is valid <strong>for</strong> isoalkanes, we may expect a very low MEK temperature (< -95°C) to<br />
immobilize squalane on TLC rod.<br />
FID Signal<br />
0 5 10 15 20 25 30<br />
Retention Time (s)<br />
− 20°C<br />
− 15°C<br />
− 10°C<br />
− 5°C<br />
Figure 2: TLC-FID chromatograms showing development <strong>of</strong> n-C20 in MEK at different temperatures<br />
Temperature, °C Squalane n-C16 n-C20 n-C24 n-C28 n-C36<br />
-40 Y N N<br />
-35 Y N* N<br />
-30 Y I N<br />
-25 Y/I N N<br />
-20 N N N<br />
-15 I N N<br />
-10 I N N<br />
-5 Y N N<br />
0 N N N<br />
5 Y/I N N<br />
10 Y N N<br />
15 Y N* N<br />
20 Y I N<br />
N- Stationary at the spotting site; N*- Stationary but with obvious leakage;<br />
Y- Movement with the solvent front; I – Intermediate between Y and N.<br />
Table 4: Behaviour <strong>of</strong> model compounds during development in MEK at different temperatures<br />
4
Critical MEK Temperature (C)<br />
40<br />
20<br />
0<br />
-20<br />
-40<br />
n-C16<br />
y = 1.04x - 58.10<br />
R 2 = 0.9969<br />
n-C20<br />
n-C24<br />
n-C28<br />
-60<br />
0 20 40 60 80 100<br />
Melting Point <strong>of</strong> n-Alkanes (C)<br />
n-C36<br />
Figure 3: The critical MEK temperature as function <strong>of</strong> the melting point <strong>of</strong> n-alkanes<br />
These results suggest that components <strong>of</strong> the wax as determined by the proposed method will depend on MEK<br />
temperature. If a temperature <strong>of</strong> -20°C is selected, n-alkanes with less than 20 carbon atoms will probably not be<br />
captured as wax. There is also an upper limit <strong>for</strong> detecting heavy n-alkanes since those substances will not move as<br />
saturates but rather stay at the spotting site due to limited solubility in n-heptane. Experiments with n-C40 indicated that<br />
the limit is around this size <strong>of</strong> n-alkane. Thus, by the TLC-FID method and at MEK temperature <strong>of</strong> -20°C, n-alkanes<br />
from C20 to C40 will be identified as waxes.<br />
4.2 Verification with commercial waxes<br />
In order to further validate the TLC-FID method, eight commercial waxes were studied (Table 1). Three <strong>of</strong> the waxes<br />
are <strong>of</strong> paraffinic type and four branded as microcrystalline by the producers. The last wax studied was a slack wax,<br />
which is a mixture <strong>of</strong> oil and wax and is obtained as a by-product from the de-waxing process <strong>of</strong> lubricating oil.<br />
Gas chromatography – mass spectroscopy (GC-MS) showed that the wax samples contain very small amount (< 0.2%)<br />
<strong>of</strong> n-alkanes smaller than C20. According to the observations made on model compounds, MEK temperature <strong>of</strong> -20°C<br />
is selected <strong>for</strong> testing <strong>of</strong> the commercial waxes. Examples <strong>of</strong> TLC-FID chromatograms are shown in Figures 4 and 5 <strong>for</strong><br />
a paraffin wax sample (Sasolwax 5805) and a microcrystalline wax sample (Sasolwax 0907), respectively. Test results,<br />
together with GC-MS data, are summarized in Table 5.<br />
FID Signal<br />
Saturates = 99.3%<br />
After developmet by n-heptane<br />
0 5 10 15 20 25 30 35<br />
Retention Time (sec)<br />
FID Signal<br />
<strong>Wax</strong>es = 93.0%<br />
After development by n-heptane<br />
and further by MEK at -20°C<br />
0 5 10 15 20 25 30 35<br />
Retention Time (sec)<br />
Figure 4: TLC-FID chromatograms <strong>of</strong> a paraffin wax (Sasolwax 5805) after the first (left) and the second<br />
step development (right)<br />
5
FID Signal<br />
Saturates = 55.7%<br />
After developmet by n-heptane<br />
0 5 10 15 20 25 30 35<br />
Retention Time (sec)<br />
FID Signal<br />
<strong>Wax</strong>es = 52.9%<br />
After developmet by n-heptane<br />
and further by MEK at -20°C<br />
0 5 10 15 20 25 30 35<br />
Retention Time (sec)<br />
Figure 5: TLC-FID chromatograms <strong>of</strong> a microcrystalline wax (Sasolwax 0907) after the first (left) and the<br />
second step development (right)<br />
<strong>Wax</strong> samples<br />
TLC-FID n-alkanes (%) by GC-MS<br />
saturates, % waxes, % < C20 C20 – C40 > C40<br />
Sasolwax 5805 99.4 93.6 0.1 84.8 1.1<br />
Sasolwax 5604 98.0 97.6 0.1 91.3 0.6<br />
Sasolwax 5891 62.6 64.0 0.0 14.1 1.9<br />
Sasolwax 0907 52.9 53.3 0.1 26.1 5.8<br />
SP 173P 98.4 98.3 0.0 89.0 0.0<br />
SP 19 68.7 68.1 0.2 59.9 19.9<br />
SP 60 59.5 49.4 0.0 9.9 2.1<br />
JA 201 96.8 35.8 0.0 48.0 0.0<br />
Table 5: Test results <strong>of</strong> commercial waxes<br />
For the paraffin type wax samples (Sasolwax 5805, Sasolwax 5604, and SP 173P), the wax contents measured by the<br />
TLC-FID method are very close to the amount <strong>of</strong> n-alkanes estimated by GC-MS. Considering the microcrystalline type<br />
wax samples (Sasolwax 5891, Sasolwax 0907, and SP 60, except <strong>for</strong> SP 19), the wax contents are considerably higher<br />
than the amount <strong>of</strong> n-alkanes. This implies that other substances contribute to the wax fraction. Microcrystalline waxes<br />
are known to consist <strong>of</strong> saturated aliphatic hydrocarbons, particularly isoalkanes and cycloalkanes. Usually the melting<br />
point is lower <strong>for</strong> isoalkanes and cycloalkanes compared to n-alkanes <strong>of</strong> the same molecular weight. In this case, the<br />
microcrystalline waxes have higher melting points (Table 1), indicating considerably higher molecular weight. This is<br />
confirmed by the observation that a substantial fraction <strong>of</strong> the microcrystalline waxes are not soluble in n-heptane at<br />
room temperature and is thus retained at the spotting point on the rod. On the other hand, the fraction developed as<br />
saturates will solidify on cooling and be retained almost completely during the development with MEK and<br />
consequently identified as wax. We believe that the microcrystalline waxes produced from residues are more similar to<br />
the waxes in bitumen than paraffinic waxes. High amount <strong>of</strong> non n-alkanes in bitumen waxes has been shown in a<br />
previous study [5].<br />
There is an exception observed <strong>for</strong> SP 19, which was also branded as the microcrystalline type. Unlike other<br />
microcrystalline waxes, the detected wax content (68.1%) in SP 19 is lower than the total amount <strong>of</strong> n-alkanes. SP 19<br />
contains unusually high total amount <strong>of</strong> n-alkanes (80% as measured by GC-MS) <strong>for</strong> being a microcrystalline wax.<br />
Careful examination <strong>of</strong> GC-MS showed that it contains about 20% n-alkanes larger than C40, which are not identified<br />
as waxes by the TLC-FID method (Cf. Section 3.1). In the other samples, the amounts <strong>of</strong> n-alkanes larger than C40 are<br />
found to be significantly low.<br />
From above investigations on the microcrystalline waxes, it is concluded that the TLC-FID method also determines<br />
some isoalkanes and cycloalkanes <strong>of</strong> high molecular weight as waxes.<br />
6
4.3 Analysis <strong>of</strong> crude oils, residues and bitumens<br />
The TLC-FID method is used to determine wax contents in various crude oils, residues, and bitumens. The samples<br />
were selected to vary largely in wax content as shown in Tables 2 and 3. Examples <strong>of</strong> TLC-FID chromatograms <strong>of</strong> a<br />
waxy residue (Russian A) are shown in Figure 6. As expected, after the first step development in n-heptane at ambient<br />
condition, two fractions are obtained: one <strong>for</strong> saturates and another <strong>for</strong> non-saturated and large size saturate<br />
components. The tailing part between the two peaks indicates that some materials are partly soluble in n-heptane and<br />
thus move slowly with the solvent. When the rod is turned upside down <strong>for</strong> the second development in MEK at -20°C,<br />
saturates are separated into waxes which are not eluted by MEK, and other substances (likely smaller isoalkanes and<br />
cycloalkanes) that move with the solvent. There are also peaks resulted from collection <strong>of</strong> the tailing part in the first<br />
step development.<br />
FID Signal<br />
Saturates<br />
Non-saturates<br />
0 5 10 15 20 25 30 35<br />
Retention Time (sec)<br />
FID Signal<br />
<strong>Wax</strong>es<br />
Other saturates<br />
Collection <strong>of</strong><br />
"tailings"<br />
Non-saturates<br />
0 5 10 15 20 25 30 35<br />
Retention Time (sec)<br />
Figure 6: TLC-FID Chromatograms <strong>of</strong> the Russian A residue after the first step development by n-heptane<br />
(left), and the second step development by MEK at -20°C (right)<br />
As already demonstrated with model substances, the temperature during the second development in MEK determines<br />
the size <strong>of</strong> the n-alkanes that crystallize. The n-alkanes <strong>of</strong> lower molecular weight crystallize at lower MEK<br />
temperature. At the same time, observations on the microcrystalline waxes samples show that, at sufficiently low<br />
temperature also non n-alkanes <strong>of</strong> high melting point may be solidified on the TLC rod and consequently determined as<br />
wax by the present method. In crude oils and residues, the temperature effect is reflected by a general increase in wax<br />
contents with decreasing MEK temperature (Figure 7). In some samples, discrepancy is observed at 0 and -10°C, which<br />
is mainly attributed to low precision <strong>of</strong> the test method <strong>for</strong> determining low wax contents.<br />
It is known that the residues selected in this study are obtained as bottom fraction in the distillation process. At the cut<br />
points, volatile components including majority <strong>of</strong> n-alkanes between C20 and C40 have been distillated. This is<br />
illustrated by a simulated distillation using HTGC in Figure 8. For this reason, one might expect lower wax contents in<br />
residues than in crude oils. Table 6 indicates that, <strong>for</strong> the Russian samples, wax contents <strong>of</strong> the residues are slightly<br />
lower than or equal to the wax contents found in the crude oils. This is surprising, since the major n-alkanes smaller<br />
than C40 are expected to be distilled at the indicated cut point. It seems reasonable to assume that the major part <strong>of</strong> the<br />
wax in the residue consist <strong>of</strong> isoalkanes and cycloalkanes. If portions <strong>of</strong> the residues in the crude oils are considered, it<br />
is possible to estimate amount <strong>of</strong> n-alkanes in the crude oils. For example, <strong>for</strong> the Russian A, the residue is about 22%<br />
<strong>of</strong> the crude oil at the cut point (555°C). At a MEK temperature <strong>of</strong> -20°C, wax contents <strong>of</strong> the crude oil and residue are<br />
determined to be 1.9% and 2.0%, respectively. A back calculation suggests that 23% <strong>of</strong> the waxes in the crude oil are<br />
retained in the residue while the major part <strong>of</strong> the waxes (77%) has gone as distillates. Thus a rough estimation <strong>for</strong> the<br />
Russian A crude is that 23% <strong>of</strong> the waxes are high molecular weight isoalkanes or cycloalkanes and 77% are n-alkanes<br />
between C20 to C40. For the Boscan samples, wax contents both in the crude oil and residue are relatively low. In this<br />
case, the major part <strong>of</strong> the n-alkanes between C20 and C40 will be retained in the residue due to the low cut point (<<br />
400°C).<br />
7
<strong>Wax</strong> (%)<br />
8<br />
6<br />
4<br />
2<br />
0<br />
-35 -30 -25 -20 -15 -10 -5 0 5<br />
Temperature (C)<br />
Figure 7: Effect <strong>of</strong> MEK temperature on determination <strong>of</strong> wax content<br />
Boiling point (°C)<br />
200 300 400 500 600 700 800<br />
Russian A: crude oil<br />
Mass 78% (BP < 555°C)<br />
C 17 C 25 C 37<br />
0 5 10 15 20 25 30 35 40 45<br />
Retention time (min)<br />
End Time<br />
Boscan crude oil<br />
Boscan residue<br />
Russian A: crude oil<br />
Russian A: residue<br />
Russian B: crude oil<br />
Russian B: residue<br />
Boiling point (°C)<br />
200 300 400 500 600 700 800<br />
Russian A: residue<br />
Start Time<br />
IBP<br />
0 5 10 15 20 25 30 35 40 45<br />
Retention time (min)<br />
Figure 8: Examples <strong>of</strong> HTGC chromatograms <strong>for</strong> a crude oil and residue (A series <strong>of</strong> peaks reveal a<br />
characteristic pattern <strong>for</strong> n-alkanes, e.g. C17, C25, and C37)<br />
The new method is finally applied to different bitumens with known wax contents (Table 3). Of the selected samples,<br />
Bit-A is considered as “wax-free” bitumen in spite <strong>of</strong> the wax content determined by EN 12606-1. In this sense “waxfree”<br />
refers to the lack <strong>of</strong> crystallizing materials during a cooling cycle in DSC. Figure 9 shows the TLC-FID<br />
chromatograms <strong>for</strong> Bit-A after the first and the second development. As illustrated, the non-waxy bitumen displays a<br />
distinct peak <strong>for</strong> saturates after the first step development in n-heptane. In the second development at -20°C, all<br />
saturates move with the solvent MEK, and no waxes are detected.<br />
A further confirmation was made by adding a known amount <strong>of</strong> n-alkane to the non-waxy bitumen (Bit-A) and then<br />
determining wax content in the mixed sample. In Figure 10, TLC-FID chromatogram is shown <strong>for</strong> the non-waxy<br />
bitumen added with 3% n-octacosane. As indicated, 1.6% n-octacosane is detected as wax, which is slightly over 50%<br />
8<br />
End Time
<strong>of</strong> the added concentration. The reason <strong>for</strong> the low yield is not known, but we might speculate that n-octacosane is<br />
partly soluble in the saturate fraction moving with MEK.<br />
FID Signal<br />
Saturates<br />
Non-saturates<br />
0 5 10 15 20 25 30 35<br />
Retention Time (sec)<br />
FID Signal<br />
<strong>Wax</strong>es = 0 %<br />
Collection <strong>of</strong><br />
“tailings”<br />
Saturates<br />
0 5 10 15 20 25 30 35<br />
Retention Time (sec)<br />
Non-saturates<br />
Figure 9: TLC-FID Chromatograms <strong>of</strong> Bit-A after the first step development by n-heptane (left), and the<br />
second step development by MEK at -20°C (right)<br />
FID Signal<br />
<strong>Wax</strong>es = 1.6%<br />
0 5 10 15 20 25 30 35<br />
Retention Time (sec)<br />
Figure 10: TLC-FID chromatogram <strong>for</strong> the now-waxy bitumen (Bit A) added with 3% n-octacosane after<br />
the first step development in n-heptane and the second step development in MEK at -20°C<br />
Figure 11 shows the TLC-FID results <strong>for</strong> all the bitumen samples, together with the results obtained by DSC and CEN<br />
methods. Again the new method shows reasonable repeatability. It is also worth mentioning that the whole procedure <strong>of</strong><br />
sample preparation, wax separation and FID detection takes less than 3 hours, and in each test run at least two samples<br />
(five rods <strong>for</strong> each sample) can be analyzed. This implies that the test method is much quicker compared to the current<br />
CEN standard method, which likely does not determine microcrystalline waxes.<br />
9
<strong>Wax</strong> content (%)<br />
7<br />
6<br />
5<br />
4<br />
3<br />
2<br />
1<br />
0<br />
TLC-FID DSC EN 12606-1<br />
Bit-A Bit-B Bit-C Bit-D Bit-E Bit-F<br />
Figure 11: <strong>Wax</strong> contents <strong>of</strong> bitumens determined by the TLC-FID, DSC and CEN methods<br />
As already discussed, both the TLC-FID method and DSC determine the crystallized waxes in bitumens. There<strong>for</strong>e<br />
correlation between the two methods would be expected. This has been confirmed by a high correlation coefficient<br />
between the two methods (Figure 12). In Figure 12, results obtained <strong>for</strong> three residues are included, and comparison is<br />
also made to the CEN standard method. It is found that correlation between the results <strong>of</strong> TLC-FID and EN 12606-1 is<br />
weak (R 2 = 0.63). In fact, we should not expect correlation between TLC-FID and EN 12606-1, because EN 12606-1 is<br />
a destructive method that may artificially create small n-alkanes; at the same time it likely does not determine<br />
microcrystalline waxes. We believe that the new method is more relevant than EN 12606-1 in determination <strong>of</strong> the<br />
waxes which really exist and crystallize in crude oils and bitumens.<br />
<strong>Wax</strong> <strong>Content</strong> by TLC-FID (%)<br />
2.5<br />
2.0<br />
1.5<br />
1.0<br />
0.5<br />
y = 0.29x - 0.04<br />
R 2 = 0.8873<br />
0.0<br />
0.0 2.0 4.0 6.0 8.0<br />
<strong>Wax</strong> <strong>Content</strong> by DSC (%)<br />
<strong>Wax</strong> <strong>Content</strong> by TLC-FID (%)<br />
2.5<br />
2.0<br />
1.5<br />
1.0<br />
0.5<br />
0.0<br />
0.0 0.5 1.0 1.5 2.0 2.5<br />
<strong>Wax</strong> <strong>Content</strong> by EN 12606-1 (%)<br />
Figure 12: Comparison <strong>of</strong> TLC-FID, DSC and EN 12606-1 <strong>for</strong> determination <strong>of</strong> wax contents in bitumen<br />
and residue samples<br />
4.4 Repeatability and reproducibility<br />
Repeatability <strong>of</strong> the TLC-FID method was extensively examined. In Figure 13, standard deviation as function <strong>of</strong><br />
measured wax content is shown. In this figure, results <strong>of</strong> different runs by re-preparation <strong>of</strong> sample solutions <strong>for</strong><br />
Russian crude oils and Bitumen F are also included. Relative standard deviations (RSD) <strong>of</strong> at least three measurements<br />
(rods) were found to be about 5% <strong>for</strong> a sample containing 4% waxes, and RSD did not exceed 15% <strong>for</strong> a sample<br />
containing 0.5% waxes.<br />
10
Stdv<br />
0.4<br />
0.3<br />
0.2<br />
0.1<br />
0.0<br />
0.0 2.0 4.0 6.0 8.0<br />
Detected wax<br />
Figure 13: Standard deviation as function <strong>of</strong> wax contents measured by the TLC-FID method<br />
To determine reproducibility <strong>of</strong> the new method, a small round robin test was carried out in three laboratories (VTI,<br />
Neste, and <strong>Nynas</strong>). In Neste and <strong>Nynas</strong>, Iatroscan MK-6s was used. At VTI, two measurements (M1, M2) at different<br />
times were conducted with Iatroscan TH-10 TLC/FID analyser MK-4. The second measurement was made about half<br />
year later when FID data acquisition system was modified. The samples selected <strong>for</strong> the test were bitumen Bit-A, which<br />
is a wax-free based on DSC analysis, and the three pairs <strong>of</strong> crude oil and residue. Results are shown in Table 6. As<br />
indicated, the standard deviations between the results <strong>of</strong> different laboratories are relatively large, thus reproducibility is<br />
not satisfactory. Differences among the laboratories may be attributed to variations in data treatment (e.g. definition <strong>of</strong><br />
base line) and in <strong>for</strong> example temperature control, sample load and elution time. The time <strong>of</strong> wax crystallization on TLC<br />
rods as well as age <strong>of</strong> the rods could also influence the results.<br />
Laboratory Bit-A Venezuelan (Boscan) Russian A Russian B<br />
crude oil residue crude oil residue crude oil Residue<br />
VTI (M1) 0 0.6 0.7 1.9 2.0 5.1 4.6<br />
<strong>Nynas</strong> 0 0.6 0.8 1.5 1.1 3.2 4.1<br />
Neste 0 0.4 0.2 1.1 0.8 2.8 1.5<br />
VTI (M2) 0 0.3 0.3 1.9 0.6 4.6 1.6<br />
Average 0 0.4 0.4 1.5 0.8 3.5 2.4<br />
Stdv 0 0.2 0.3 0.4 0.3 0.9 1.5<br />
Table 6: <strong>Wax</strong> contents (%) determined by different laboratories<br />
5. CONCLUSIONS<br />
A new method based on TLC-FID is developed to determine wax content. It has been verified by various model<br />
compounds, including n-alkanes, isoalkane, as well as different types <strong>of</strong> commercial wax.<br />
The TLC-FID method detects waxes mainly composed <strong>of</strong> n-alkanes ranging from C20 to C40, and large isoalkanes<br />
and cycloalkanes <strong>of</strong> high melting point if those compounds are soluble in n-heptane.<br />
The new method is applicable to a variety <strong>of</strong> samples, such as crude oils, residues and bitumens. It is simple and<br />
quick, and has reasonable repeatability.<br />
Good correlation exists between wax contents determined by the TLC-FID and DSC methods.<br />
There is a need to improve reproducibility <strong>of</strong> the test method.<br />
11
It is presumed that, by changing MEK temperature in the development chamber, waxes may be further<br />
characterized by TLC-FID.<br />
6. ACKNOWLEDGEMENTS<br />
The project was financed jointly by Neste Oil (Finland) and AB Nynäs Petroleum (Sweden). The authors would like to<br />
thank Mr. Jorma Virkki and Ms. Jaana Makkonen at Neste and Mr. Timo Blomberg at <strong>Nynas</strong> <strong>for</strong> their contribution to<br />
the project. The authors also wish to thank Mr. Kim Wickström (Neste) <strong>for</strong> per<strong>for</strong>ming GC-MS, as well as their own<br />
technical staffs <strong>for</strong> laboratory assistance.<br />
REFERENCES<br />
[1] Richter, F. “Effect <strong>of</strong> waxes on bitumen quality.” Oil Gas European Magazine, No. 2, 2002, pp. 35-38.<br />
[2] Such, C., Planque, L., Lombardi, B., Planche, J.P., Gillet, J.P. “Seive A., Les paraffines dans les bitumes.”<br />
Proceedings <strong>of</strong> 2 nd Eurasphalt & Eurobitume Congress, Barcelona, Sept. 20-22, 2000, Book 1, pp. 846-854.<br />
[3] Mckay, J.F., Branthaver, J.F., Robertson, R.E. “Isolation <strong>of</strong> waxes from asphalts and influence <strong>of</strong> waxes on<br />
asphalt rheological properties.” Preprints, Division <strong>of</strong> Petroleum Chemistry, ACS 210 th National Meeting,<br />
Chicago, IL, August 20-25, 1995, pp. 794-798.<br />
[4] Lu, X, Redelius, P. “Effect <strong>of</strong> bitumen wax on asphalt mixture per<strong>for</strong>mance.” Construction and Building<br />
Materials, Vol. 21, 2007, pp. 1961-1970.<br />
[5] Lu, X, Redelius, P. “Compositional and structural characterization <strong>of</strong> waxes isolated from bitumens.” Energy<br />
Fuels, Vol. 20, 2006, pp. 653-660.<br />
[6] Planche, J.P., Claudy, P.M., Let<strong>of</strong>fe, J.M., Martin, D. “Using thermal analysis methods to better understand<br />
asphalt rheology.” Thermochimica Acta, No. 324, 1998, pp. 223-227.<br />
[7] Michon, L.C., Netzel, D.A., Turner, T.F., Martin, D., Planche, J.P. “A 13 C NMR and DSC study <strong>of</strong> the<br />
amorphous and crystalline phases in asphalts.” Energy Fuels, Vol. 13, 1999, pp. 602-610.<br />
[8] European Standard EN 12606-1. “Bitumen and bituminous binders – determination <strong>of</strong> the paraffin wax content<br />
– part 1: method by distillation”.<br />
[9] European Stand EN 12606-2. “Bitumen and bituminous binders – determination <strong>of</strong> the paraffin wax content –<br />
part 2: method by extraction”.<br />
[10] Hartner, O. “Ermittlung des Gehaltes an Heptan-Unlöslichem und des <strong>Paraffin</strong>haltes aus den Ergebnissen der<br />
Bitumenanalyse mittels DC-FID.” Bitumen, No. 4, 1998, pp. 133-136.<br />
[11] Ecker, A. “The application <strong>of</strong> Iatroscan-technique <strong>for</strong> analysis <strong>of</strong> bitumen.” Petroleum and Coal, Vol. 43,<br />
2001, pp. 51-53.<br />
12


![Säkerhetsbestämmelser Gbg rev 5.ppt [Compatibility Mode] - Nynas](https://img.yumpu.com/18742268/1/190x146/sakerhetsbestammelser-gbg-rev-5ppt-compatibility-mode-nynas.jpg?quality=85)