ASPRS LIDAR GUIDELINES: Horizontal Accuracy Reporting
ASPRS LIDAR GUIDELINES: Horizontal Accuracy Reporting
ASPRS LIDAR GUIDELINES: Horizontal Accuracy Reporting

You also want an ePaper? Increase the reach of your titles
YUMPU automatically turns print PDFs into web optimized ePapers that Google loves.
<strong>ASPRS</strong> <strong>LIDAR</strong> <strong>GUIDELINES</strong>:<br />
<strong>Horizontal</strong> <strong>Accuracy</strong> <strong>Reporting</strong>
THE CONTENTS<br />
1. ABBREVIATIONS ...........................................................................................................5<br />
2. TERMINOLOGY..............................................................................................................6<br />
3. INTRODUCTION .............................................................................................................8<br />
4. THE TASKS OF THE <strong>GUIDELINES</strong>............................................................................... 10<br />
5. THE PURPOSE OF QA/QC ............................................................................................ 11<br />
6. A BRIEF REVIEW OF EXISTING STANDARDS ............................................................ 12<br />
7. ERROR EFFECTS AND RECOMMENDATIONS ............................................................ 21<br />
8. REFERENCES ............................................................................................................... 37<br />
9. APPENDIX A: HORIZONTAL ACCURACY ASSESSMENT AND THE NSSDA<br />
STANDARD........................................................................................................................... 48
List of figures<br />
FIGURE 1. FLOWCHART SHOWING THE CURRENT INVOLVEMENT IN DEVELOPING OF THE <strong>LIDAR</strong><br />
<strong>GUIDELINES</strong> ..................................................................................................................... 12<br />
FIGURE 2. ILLUSTRATIONS OF THE RESULTS OF MISALIGNMENTS.................................................... 22<br />
FIGURE 3. INFLUENCE OF ROLL ON THE POSITIONS OF THE FOOTPRINTS OF THE LASER SHOTS ON THE<br />
GROUND .......................................................................................................................... 24<br />
FIGURE 4. INFLUENCE OF HEADING ON THE POSITIONS OF THE FOOTPRINTS OF THE LASER SHOTS ON THE<br />
GROUND .......................................................................................................................... 25<br />
FIGURE 5. INFLUENCE OF PITCH ON THE POSITIONS OF THE FOOTPRINTS OF THE LASER SHOTS ON THE<br />
GROUND .......................................................................................................................... 25<br />
FIGURE 6. A GENERAL VIEW OF A GPS GROUND CONTROL NETWORK .............................................. 30
List of tables<br />
TABLE 1. COMPARISON OF NMAS/NSSDA HORIZONTAL ACCURACY ............................................. 15<br />
TABLE 2. COMPARISON OF HORIZONTAL ACCURACY STANDARDS .................................................. 17<br />
TABLE 3. <strong>ASPRS</strong> ACCURACY STANDARDS FOR LARGE-SCALE MAPS CLASS 1 HORIZONTAL (X OR Y)<br />
LIMITING RMSE FOR VARIOUS MAP SCALES AT GROUND SCALE FOR FEET UNITS ....................... 19<br />
TABLE 4. <strong>ASPRS</strong> ACCURACY STANDARDS FOR LARGE-SCALE MAPS CLASS 1 HORIZONTAL (X OR Y)<br />
LIMITING RMSE FOR VARIOUS MAP SCALES AT GROUND SCALE FOR METRIC UNITS.................... 20<br />
TABLE 5. EXAMPLES OF THE VALUES OF POSITIONING ERRORS DEPENDING ON THE FLIGHT ALTITUDE<br />
AND THE ANGULAR ERROR ................................................................................................. 26
1. ABBREVIATIONS<br />
ALS – Airborne Laser Scanning<br />
DEM – Digital Elevation Model<br />
DTM – Digital Terrain Model<br />
IMU – Inertial Measurement Unit<br />
INS – Inertial Navigation System<br />
POS – Positioning System<br />
FEMA – Federal Emergency Management Agency<br />
NDEP – National Digital Elevation Program<br />
NOAA – National Oceanic and Atmospheric Administration<br />
USACE – U.S. Army Corps of Engineers<br />
USGS – U.S. Geological Survey<br />
FGDC – Federal Geographic Data Committee<br />
NSDI – National Spatial Data Infrastructure<br />
NSSDA – National Standard for Spatial Data <strong>Accuracy</strong>
2. TERMINOLOGY<br />
Be aware that practitioners in the fields of surveying, mapping, and GIS<br />
are not always consistent in their use of these terms. Sometimes the<br />
terms are used almost interchangeably, and this should be avoided. Here<br />
the most commonly used terms will be presented and explained.<br />
Quality Assurance (QA) is the process of evaluating overall project<br />
performance on a regular basis to provide confidence that the project<br />
will satisfy the relevant quality standards.<br />
Quality Control (QC) is the process of monitoring specific project results<br />
to determine if they comply with relevant quality standards, and<br />
identifying means of eliminating causes of unsatisfactory performance.<br />
It is important to distinguish between such terms as “accuracy” and<br />
“precision”.<br />
<strong>Accuracy</strong> is the degree to which information on a map or in a digital<br />
database matches true or accepted values. <strong>Accuracy</strong> is an issue<br />
pertaining to the quality of data and the number of errors contained in a<br />
dataset or map. In discussing a GIS database, it is possible to consider<br />
horizontal and vertical accuracy with respect to geographic position, as<br />
well as attribute, conceptual, and logical accuracy.<br />
The NSSDA uses root-mean-square error (RMSE) to estimate positional<br />
accuracy. RMSE is the square root of the average of the set of squared<br />
differences between dataset coordinate values and coordinate values<br />
from an independent source of higher accuracy for identical points.<br />
<strong>Accuracy</strong> is reported in ground distances at the 95% confidence level.<br />
<strong>Accuracy</strong> reported at the 95% confidence level means that 95% of the<br />
positions in the dataset will have an error with respect to true ground
position that is equal to or smaller than the reported accuracy value.<br />
The reported accuracy value reflects all uncertainties, including those<br />
introduced by geodetic control coordinates, compilation, and final<br />
computation of ground coordinate values in the product.<br />
Precision refers to the level of measurement and exactness of<br />
description in a dataset. Precise locational data may measure position to<br />
a fraction of a unit. Precise attribute information may specify the<br />
characteristics of features in great detail. It is important to realize,<br />
however, that precise data--no matter how carefully measured--may be<br />
inaccurate. Surveyors may make mistakes or data may be entered into<br />
the database incorrectly.<br />
The level of precision required for particular applications varies greatly.<br />
Engineering projects such as road and utility construction require very<br />
precise information measured to the millimeter or tenth of an inch.<br />
Highly precise data can be very difficult and costly to collect manually.<br />
High precision does not indicate high accuracy nor does high accuracy<br />
imply high precision.<br />
Boresight error - the angular misalignment between the laser sensor unit<br />
and IMU<br />
Absolute offset – the measurement of location of a point of interest,<br />
which has known coordinates, throughout the lidar data, where it is<br />
visible<br />
Relative offset – the measurement of discrepancies between tie-points in<br />
the overlap between two or more strips
3. INTRODUCTION<br />
Lidar technology has became a very well-used remote sensing tool<br />
among land surveyors and the mapping community worldwide. It must<br />
be pointed out that a topographic airborne lidar is not intended to totally<br />
replace conventional surveying but rather serve to complement and<br />
increase the efficiency of existing remote sensing and mapping means.<br />
Such a tool can be efficiently employed in remote, inaccessible, and<br />
forested areas, in order to collect the bare-earth feature, and ground<br />
information. There is no doubt that the lidar data produces reliable data<br />
for height determination. The lidar datasets can be viewed as multi-<br />
phase data. For example, as the project progresses, the client may want<br />
to enhance lidar accuracy by adding additional breaklines. Combining<br />
data with a more limited ground survey serves to enhance accuracy, and<br />
save time and expenses.<br />
Currently the common use of ALS is generating surface terrain models,<br />
which are DEMs and enhanced DTMs. Some typical applications are as<br />
follows:<br />
• visibility analyses (i.e., power transmission lines, mining industry<br />
and urban planning)<br />
• rectification of imagery in photogrammetry<br />
• rectification of data from hyper-spectral and satellite sensors<br />
• improving existing hydrological models<br />
• feature detection (i.e., 3-D modeling of buildings, roads, rail roads,<br />
and river banks)<br />
• biometric analyses (i.e., forestry, flood planning, and coastal<br />
monitoring)<br />
• producing contours (a less detailed representation of the scene as<br />
compared to filtered laser data)
In some cases horizontal accuracy is considered as less important<br />
information than vertical accuracy. For example, the desired information<br />
for visibility analyses of power transmission lines or biometric analyses<br />
in forestry are not driven by positional accuracy information of the<br />
subjects. Rather the height information of trees or crown size, and<br />
profiles of wires are of importance.<br />
However, there are certain applications, which already require the lidar<br />
dataset to meet expectations for horizontal accuracy. For instance, one<br />
such area of applications would be obstacle avoidance. An obstruction<br />
survey of an airport area differs dramatically from flood mapping or<br />
bare-earth terrain mapping.
4. THE TASKS OF THE <strong>GUIDELINES</strong><br />
The major tasks of these guidelines are the following:<br />
- To provide any user, who employs a topographic airborne laser<br />
scanning system, with appropriate common guidelines and<br />
recommendations for acquiring accurate digital lidar elevation data.<br />
- To assist companies and agencies in establishing standards for their<br />
organizations for a routing work.<br />
- To help to reduce the overall time the customer needs for planning<br />
and acquiring the desired data as straight forwardly as possible.<br />
These guidelines are designed to support the common customer<br />
demands for accuracy of the lidar dataset regardless of the type of the<br />
airborne laser scanning system, and regardless of a scan pattern on the<br />
ground surface.
5. THE PURPOSE OF QA/QC<br />
The importance of quality assurance (QA) and quality control (QC) is an<br />
essential issue in processing and handling of the data set delivered by<br />
the laser scanning, especially, airborne. There are a number of studies,<br />
assessments and evaluations, which have been carried out by academic,<br />
governmental, and private organizations in the last decade.<br />
In general, in the content of this paper, the purpose of the QA / QC<br />
procedures is to guarantee efficient and consistent validation of complex<br />
data set delivered by the laser sensor, INS, and GPS.
6. A BRIEF REVIEW OF EXISTING STANDARDS<br />
A General Status of Current Work<br />
There is work going on among different communities like remote sensing<br />
and mapping practitioners, land surveyors and GIS professionals. This<br />
work is focused on developing common guidelines for using topographic<br />
airborne lidar, which is becoming more and more popular, and<br />
processing laser data. A brief description of the work with respect to<br />
reporting horizontal accuracy will be given.<br />
FGDC<br />
NDEP<br />
NSSDA<br />
LiDAR <strong>GUIDELINES</strong><br />
FEMA<br />
USACE<br />
NOAA<br />
USGS<br />
<strong>ASPRS</strong><br />
Figure 1. Flowchart showing the current involvement in developing of<br />
the lidar guidelines<br />
There is an existing common standard NSSDA, which is widely used<br />
within the mapping, cartographic and remote sensing communities. It<br />
defines statistical and testing methodologies for estimating the
positional accuracy of points on maps and in digital geospatial data, with<br />
respect to georeferenced ground positions of higher accuracy. The final<br />
digital maps and other deliverables of the ALS are expected to meet the<br />
accuracy requirements established in NSSDA too.<br />
The lidar guidelines, which are being developed and prepared by the<br />
<strong>ASPRS</strong> Lidar Committee, cover the recommended methods for measuring<br />
and reporting the accuracies of digital elevation data recorded by<br />
airborne lidar mapping instruments. In addition, the Guidelines cover<br />
determining what level of accuracy can be associated with a mapping<br />
product that is generated from a lidar dataset. They also include<br />
recommendations for the proper planning and implementation of<br />
appropriate ground checkpoints to support a lidar dataset, including how<br />
to handle different land cover classes across a project site. Furthermore,<br />
the lidar guidelines are in compilance with the relevant sections of the<br />
Guidelines for Digital Elevation Data released by the NDEP.<br />
NDEP is a program, whose main purpose is to promote the exchange of<br />
accurate digital land elevation data among government, private and non-<br />
profit sectors, and the academic community, and to establish standards<br />
and guidance that will benefit all users. Such members of this program<br />
as FEMA, USACE, NOAA, and USGS have contributed their “best practice”<br />
concerns regarding lidar.<br />
FGDC has already accepted a standard FGDC-STD-007.3-1998, which is<br />
called “Geospatial Positioning <strong>Accuracy</strong> Standards, Part 3: National<br />
Standard for Spatial Data <strong>Accuracy</strong>.” It has been developed to provide a<br />
common reporting mechanism so that users can directly compare<br />
datasets for their applications. It was realized that map-dependent<br />
measures of accuracy, such as contour interval, can be not fully<br />
applicable when digital geospatial data can be readily manipulated and<br />
output to any scale or data format. Principal changes included
equirements to report numeric accuracy values, for instance, a<br />
composite statistic for horizontal accuracy, instead of component X, Y<br />
accuracy. Additionally, this standard defines and describes requirements<br />
for ground truth and supporting GPS data collection.<br />
These organizations have, in particular, prepared some recommendations<br />
for applying ALS, which are directed towards their particular needs in<br />
the most effective way:<br />
• FEMA in 2000<br />
• U.S. Army Corps of Engineers in 2002<br />
• <strong>ASPRS</strong> <strong>Reporting</strong> Vertical <strong>Accuracy</strong> in 2004<br />
• NOAA (updated Web-site, 20 February 2005)<br />
Of course, there are a number of internal guidelines and instructions for<br />
lidar scanning, which are used by the operators of ALS. However, they<br />
are not being considered here, because those guidelines would not be<br />
fully applicable in general practice and are often very specific task-<br />
oriented.<br />
<strong>Horizontal</strong> <strong>Accuracy</strong> in NSSDA and NMAS<br />
<strong>Horizontal</strong> accuracy is strongly related by the requirements of vertical<br />
accuracy. When a high vertical accuracy is required, then it will be<br />
essential for the data producer to maintain high horizontal accuracy.<br />
This is because horizontal errors in elevation data normally, but not<br />
always, contribute significantly to the error detected in vertical accuracy<br />
tests.<br />
<strong>Horizontal</strong> error is more difficult than vertical error to assess in lidar<br />
datasets. This is because the land surface often lacks well-defined<br />
topographic features, which are required for such tests, or because the
esolution of the elevation data is too coarse for precisely locating<br />
distinct surface features.<br />
There are minimum expectations of horizontal accuracy for elevation<br />
data acquired using lidar, which are recommended by <strong>ASPRS</strong>. They are<br />
summarized in the following Table 1, which shows the interrelationship<br />
between the NMAS and NSSDA extrapolated values. Typically, it is<br />
required that the lidar data producer applies an appropriate methodology<br />
for elevation data collection by lidar. It is also assumed that the<br />
horizontal control structure is well known.<br />
NMAS<br />
Map Scale<br />
NMAS<br />
CMAS<br />
90%<br />
NSSDA<br />
RMSE(r)<br />
NSSDA<br />
<strong>Accuracy</strong>(r) 95%<br />
confidence level<br />
1" = 100' or 1:1,200 3.33 ft 2.20 ft or 67.0 cm 3.80 ft or 1.159 m<br />
1" = 200' or 1:2,400 6.67 ft 4.39 ft or 1.339 m 7.60 ft or 2.318 m<br />
1" = 400' or 1:4,800 13.33 ft 8.79 ft or 2.678 m 15.21 ft or 4.635 m<br />
1" = 500' or 1:6,000 16.67 ft 10.98 ft or 3.348 m 19.01 ft or 5.794 m<br />
1" = 1000' or 1:12,000 33.33 ft 21.97 ft or 6.695 m 38.02 ft or 11.588 m<br />
1" = 2000' or 1:24,000 * 40.00 ft 26.36 ft or 8.035 m 45.62 ft or 13.906 m<br />
Table 1. Comparison of NMAS/NSSDA <strong>Horizontal</strong> <strong>Accuracy</strong><br />
* The 1:24,000- and 1:25,000-scales of USGS 7.5-minute quadrangles are smaller<br />
than 1:20,000; therefore, the NMAS horizontal accuracy test for well-defined test<br />
points is based on 1/50 inch, rather than 1/30 inch for maps with scales larger than<br />
1:20,000
FEMA and <strong>ASPRS</strong><br />
The FEMA’s guidelines recommend the following:<br />
The 1/30-inch standard for large-scale maps is called the Circular Map<br />
<strong>Accuracy</strong> Standard (CMAS). The NMAS became obsolete for digital<br />
mapping products because computer software can easily change the<br />
scale of a map, and maps do not become more accurate just because the<br />
computer software and/or user may “zoom in” on the map to display it<br />
and/or produce it at a larger scale.<br />
To prevent abuse of digital mapping data, the mapping industry<br />
operated during much of the 1990s under <strong>ASPRS</strong> 1990 Standards. The<br />
<strong>ASPRS</strong> 1990 Standards established limiting RMSEs for three classes of<br />
maps (Class 1, Class 2, Class 3), along with typical map scales<br />
associated with the limiting errors. Three times the “limiting RMSE” was<br />
essentially a 100-percent confidence level standard.<br />
In 1998, the FGDC published the NSSDA, which superseded both the<br />
NMAS and the <strong>ASPRS</strong> 1990 Standards for digital mapping products.<br />
NSSDA implemented a statistical and testing methodology for estimating<br />
the positional accuracy of points on maps and in digital geospatial data,<br />
with respect to georeferenced ground positions of higher accuracy.<br />
Radial RMSE (RMSEr) calculations were established, and radial accuracy<br />
(<strong>Accuracy</strong>r) at the 95-percent confidence level was established as 1.7308<br />
x RMSEr. <strong>Accuracy</strong>r is defined as “the radius of a circle of uncertainty,<br />
such that the true or theoretical location of the point falls within that<br />
circle 95-percent of the time.” NSSDA specifies horizontal errors at the<br />
95-percent confidence level, whereas the NMAS specified horizontal<br />
errors at the 90-percent confidence level, and <strong>ASPRS</strong> 1990 specified<br />
horizontal errors at nearly the 100-percent confidence level. When
assuming all horizontal errors have a normal distribution, the<br />
NSSDA/NMAS conversion factor is as follows:<br />
<strong>Accuracy</strong>r = CMAS x 1.1406<br />
With NSSDA, RMSEr is defined in terms of feet or meters at ground scale<br />
rather than in inches or millimeters at the target map scale. The RMSEr<br />
of a DFIRM panel is the cumulative result of all errors, including those<br />
introduced by mapping partners in performing ground surveys, aerial<br />
triangulation, map compilation, and digitization activities. The RMSEr and<br />
<strong>Accuracy</strong>r values shown in Table 2 are the maximum permissible values<br />
established by NSSDA for base maps compiled at 1"=500' and 1”=1000’<br />
under NMAS. Table A-1 serves as a “crosswalk” between the NMAS,<br />
NSSDA, and The <strong>ASPRS</strong> 1990 horizontal accuracy standards.<br />
RMSEr = sqrt(RMSEx 2 + RMSEy 2 ).<br />
NMAS<br />
Map Scale<br />
NMAS<br />
CMAS<br />
90% confidence level<br />
NSSDA<br />
<strong>Accuracy</strong> r<br />
95% confidence level<br />
NSSDA<br />
RMSE r<br />
<strong>ASPRS</strong> 1990<br />
Class 1/2/3<br />
Limiting RMSE r<br />
1” = 500’ 16.7 feet 19.0 feet 11.0 feet 7.1 feet (Class 1)<br />
14.1 feet (Class 2)<br />
21.2 feet (Class 3)<br />
1" = 1,000' 33.3 feet 38.0 feet 22.0 feet 14.1 feet (Class 1)<br />
28.3 feet (Class 2)<br />
42.4 feet (Class 3)<br />
1” = 2,000’ 40.0 feet 45.6 feet 26.3 feet 28.3 feet (Class 1)<br />
Table 2. Comparison of <strong>Horizontal</strong> <strong>Accuracy</strong> Standards<br />
56.5 feet (Class 2)<br />
84.9 feet (Class 3)
Thus, when FEMA specifies a base map at 1" = 500', for example, this is<br />
the same as FEMA specifying that a digital base map should have a<br />
horizontal RMSEr of 11 feet or <strong>Accuracy</strong>r of 19 feet at the 95-percent<br />
confidence level, for consistency with the new NSSDA.<br />
When a base map is compiled at 1”=1,000’ and is published at a<br />
hardcopy map scale of 1”=500’, the horizontal accuracy remains that of<br />
the 1”=1,000’ map scale. Therefore, such a 1”=500’ map would be<br />
compiled to meet 38-foot horizontal accuracy at 95-percent confidence<br />
level, rather than 19-foot horizontal accuracy at 95-percent confidence<br />
level as is normally expected of maps published at a scale of 1”=500’.<br />
This is an example where “zooming in” on a map image does not make<br />
the map any more accurate.
Planimetric <strong>Accuracy</strong> Requirements Due to The <strong>ASPRS</strong> Classes<br />
The data acquired by the means of ALS is also expected to meet<br />
requirements of planimetric accuracy, which are defined by the <strong>ASPRS</strong>.<br />
<strong>Accuracy</strong> Standards for Large-Scale Maps is shown in the following<br />
tables:<br />
Class 1 Planimetric <strong>Accuracy</strong>,<br />
limiting RMSE (feet)<br />
Map<br />
Scale<br />
0.05 1:60<br />
0.1 1:120<br />
0.2 1:240<br />
0.3 1:360<br />
0.4 1:480<br />
0.5 1:600<br />
1.0 1:1,200<br />
2.0 1:2,400<br />
4.0 1:4,800<br />
5.0 1:6,000<br />
8.0 1:9,600<br />
10.0 1:12,000<br />
16.7 1:20,000<br />
Table 3. <strong>ASPRS</strong> <strong>Accuracy</strong> Standards for Large-Scale Maps Class 1 horizontal<br />
(X or Y) limiting RMSE for various map scales at ground scale for feet units
Class 1 Planimetric <strong>Accuracy</strong><br />
Limiting RMSE (meters)<br />
Map<br />
Scale<br />
0.0125 1:50<br />
0.025 1:100<br />
0.050 1:200<br />
0.125 1:500<br />
0.25 1:1,000<br />
0.50 1:2,000<br />
1.00 1:4,000<br />
1.25 1:5,000<br />
2.50 1:10,000<br />
5.00 1:20,000<br />
Table 4. <strong>ASPRS</strong> <strong>Accuracy</strong> Standards for Large-Scale Maps Class 1 horizontal<br />
(X or Y) limiting RMSE for various map scales at ground scale for metric units<br />
Class 2 accuracy applies to maps compiled within limiting RMSE’s twice<br />
those allowed for Class 1 maps. Similarly, Class 3 accuracy applies to<br />
maps compiled within limiting RMSE’s three times those allowed for Class<br />
1 mapping.
7. ERROR EFFECTS AND RECOMMENDATIONS<br />
The level of readiness of ALS for very high resolution application has<br />
been numerously and thoroughly investigated and evaluated by<br />
authorized and competent organizations around the world since the<br />
middle of ‘90s. Mainly, these investigations were devoted to assessing<br />
vertical accuracy of the laser dataset and relative error sources.<br />
The important role of planimetric accuracy can be clearly visible,<br />
especially, when merging different datasets, for example, a laser point<br />
cloud and existing (digital) maps. Although all the necessary error<br />
filtering is done in the raw lidar data, it would be still possible that the<br />
control points are mismatched in a final product. The misalignments are<br />
often caused by careless or incomplete in-flight performances of a pilot,<br />
or a weak calibration, for example. Therefore, data fusion would be<br />
successful only, if the laser dataset and other data sources are spatially<br />
consistent.<br />
Concerning horizontal accuracy, the major error sources in ALS are the<br />
following:<br />
- Positioning of the carrying platform<br />
- Orientation determination<br />
- Offsets between the laser sensor, INS/POS equipment and an<br />
aircraft platform<br />
- Errors in the electro-optical parts of the laser sensor<br />
- Wrong laser and INS/POS data processing<br />
- Careless integration and interpolation of the INS and GPS<br />
data (Pre-processing)<br />
- Erroneous data from the reference ground GPS base stations<br />
- Wrong data/coordinate transformation
Based on the currently used lidar data processing methods and<br />
algorithms, errors in ALS can be classified into four groups: error per<br />
block, error per strip, error per GPS observation, and error per point.<br />
The error from the IMU is of particular concern, as systematic<br />
differences on strips depend strongly on the error from the IMU. The<br />
IMU is one of the main causes of horizontal error in scanned data points,<br />
and errors very often increase or decrease with consistency in a flight’s<br />
direction. This error consistency implies a linear relationship.<br />
The most critical error in the ALS systems is the angular misalignment<br />
between the laser sensor and the navigational and positional systems<br />
(the boresight error). Errors, which are induced by the misalignment, are<br />
a function of flying height, scan angle and flying direction. For example,<br />
at a flying altitude of the ALS platform of 700 meters and an off-nadir<br />
scanning angle of 15 degrees, a misalignment of 0.1 degrees will result<br />
in a height error of 32 cm, and a planimetric error of 131 cm. It is<br />
obvious that the values of elevation and error are of different orders.<br />
These errors are readily apparent in overlapping ALS data. Comparing<br />
areas with elevation gradients (i.e., buildings with a clear structure) will<br />
reveal inconsistencies. The effects of roll, pitch, and heading on errors<br />
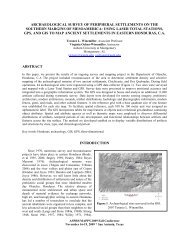
are illustrated in below figure.<br />
(a) (b) (c)<br />
Figure 2. Illustrations of the results of misalignments
The misalignment between the laser and the IMU causes each laser<br />
observation to be registered incorrectly. The dot in Figure 2 depicts a<br />
mis-registered laser observation. The pitch error (Figure 2a) results in a<br />
laser slant range to be recorded as nadir. As the slant range is longer,<br />
the entire strip tends to be pushed down. A roll error also causes a slant<br />
range to be incorrectly registered. The elevation differences tend to<br />
increase with a larger scan angle (Figure 2b). The heading error induces<br />
a skewing in each scan line (Figure 2c). Unlike a photographic image, a<br />
boresight error affects each observation and cannot be removed by<br />
applying a simple affine transformation to the entire strip. Instead the<br />
differences must be modeled by observing the induced errors in position<br />
of control points or common feature points.
Flight conditions<br />
Typically, a pilot who is involved in remote sensing business is familiar<br />
and experienced with carrying out the traditional aerial photography.<br />
There such flight parameters as roll, pitch, and (heading (i.e., yaw) are<br />
not as critical as compared to the flights with the airborne laser<br />
scanning systems. Misunderstanding and/or ignoring the importance of<br />
these parameters for the accuracy of the laser data would easily lead to<br />
the gaps (“black holes”) in the laser point clouds. In the worst case, the<br />
pilot would completely miss the target, because of the extreme values<br />
for roll, for example.<br />
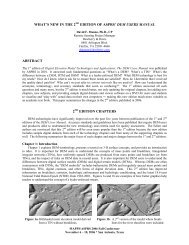
Figure 3. An influence of roll on the positions of the footprints of the laser<br />
shots on the ground
Figure 4. An influence of heading on the positions of the footprints of the<br />
laser shots on the ground<br />
Figure 5. An influence of pitch on the positions of the footprints of the laser<br />
shots on the ground<br />
Any changes in the angle of roll cause a dramatic displacement of the<br />
laser spots on the ground, which causes an error in height. The bigger<br />
an inclination, the greater an effect (error).
The changes in heading cause the displacement of the laser spots along<br />
the flight track. Typically, the error in height is not significant.<br />
The movement about the Z-axis causes usually displacements of only<br />
few centimeters. The displacement between neighboring points at the<br />
edges of the scan path across the flight line is larger, than in the middle<br />
of the scan swath.<br />
The below following table shows a few examples how the positioning<br />
error is dependant uppon the angular error (Figure 5):<br />
flight altitude angular error positioning error<br />
2000 m 0.005 ° 0.17 m<br />
4000 m 0.005 ° 0.35 m<br />
6000 m 0.005 ° 0.52 m<br />
Table 5. Examples of the values of positioning errors depending on the flight<br />
altitude and the angular error
OPERATIONAL <strong>GUIDELINES</strong><br />
۩ The pilot must be correctly instructed and, preferably,<br />
trained before taking off with the laser scanner on<br />
board:<br />
• No unnecessary (sudden) movements or deep<br />
inclinations (turns) when the laser sensor is<br />
switched on, so that: (a) to keep the onboard GPS<br />
successfully and continuously locked on with the<br />
required number of the GPS satellites, and (b) to<br />
not produce “black holes” or gaps in the laser<br />
dataset.<br />
• Stay on line all the time during the recording of the<br />
laser, navigation, and positioning data.<br />
• Maintain the constant flight ground speed in order<br />
to insure the planned laser point density.<br />
• Maintain the fixed flight altitude above ground, in<br />
order to insure (a) a secure flight, and (b) the<br />
planned laser point density.<br />
۩ The banking angle must not exceed the angle of<br />
elevation of the locked satellites above the horizon<br />
(typically max 15º)
۩ No large banking angles, because the INS can be<br />
temporally suspended, because of the effect of gravity<br />
۩ A typical INS system must meet the following flight<br />
limits:<br />
• ≤ 0.005 ° for roll<br />
• ≤ 0.005 ° for pitch<br />
• ≤ 0.008 ° for heading (i.e., yaw)
Ground GPS Network<br />
A surveying mission, which involves an airborne laser scanning system,<br />
must be accomplished by a correct support from the GPS ground base<br />
stations. Without a ground GPS network, the whole laser scanning<br />
mission is not usable, because the laser dataset cannot be linked to 3D<br />
real world coordinates.<br />
A proper planning of the ground GPS network must be performed before<br />
beginning a data collection mission. This GPS network must fulfill the<br />
following requirements, at a minimum:<br />
• completely free of errors<br />
• include six known control points for quality control<br />
purposes<br />
• minimum two points, which will form a base of<br />
production of a flight trajectory, that are completely<br />
open to the sky, i.e., free from a multi-path effect of<br />
the GPS signal and cycle slip noise<br />
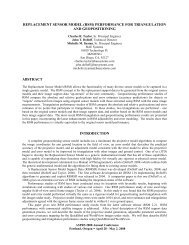
As compared to photogrammetric measurements, erroneous ground<br />
control points have high residuals, which can be checked in aerial<br />
images and corrected. In the case of the lidar data, the laser, GPS and<br />
navigational data cannot be treated in the same way as it has been done<br />
earlier using the traditional triangulation method.<br />
Additionally, three of six known control points must be fixed, in order to<br />
control the scale, orientation and position in the least square<br />
adjustment. The other three are used as additional check points.
Figure 6. A general view of a GPS ground control network
GPS <strong>GUIDELINES</strong><br />
۩ The GPS ground control survey should be performed by a<br />
licensed surveying subcontractor, in order to minimize<br />
the risk of getting erroneous results.<br />
۩ It is strongly suggested to deploy eight known points in<br />
the ground GPS control framework, at a minimum.<br />
۩ The two open GPS control points are better set on the<br />
roofs of two suitably located, stable buildings.<br />
۩ The distance between the ground reference GPS base<br />
stations and the GPS receiver(s) onboard the flying<br />
carrying platform is suggested 30 km to 50 km in a flat<br />
and obstacle-free area. In hilly and forested areas, this<br />
distance is smaller, typically, 15 km to 20 km.<br />
۩ Especially for a large area projects, it is necessary to<br />
include the settings of the atmospheric conditions in<br />
calculations of a GPS trajectory.
Onboard Positioning System<br />
Nowadays, the use of differential carrier phase global positioning system<br />
(DGPS) in kinematic mode has become widely used.<br />
Satellite geometry has a major role in GPS positioning reliability. It is<br />
quantified by Positional Dilution Of Precision (PDOP). Poor satellite<br />
geometry or, in other words, a high PDOP, generates inaccurate GPS<br />
coordinates.
DGPS <strong>GUIDELINES</strong><br />
۩ A minimum of four visible satellites is required to position a<br />
GPS receiver using the DGPS system. Having six visible<br />
satellites is desirable.<br />
۩ The survey time must be planned and optimized so that<br />
there is at least one visible satellite in each of the four<br />
quadrants.<br />
۩ At least PDOP < 3 in rough or vegetated area;<br />
PDOP < 4 typically<br />
۩ Observing longer GPS baselines, it is necessary to be aware<br />
of inaccurate orbit parameters (if available), which might<br />
introduce significant errors, and apply the necessary<br />
corrections in post-processing.<br />
۩ Typically, GPS measurements are most reliable using dual<br />
frequency, 2 Hz GPS receivers.<br />
۩ Onboard an aircraft the GPS receivers must be placed on<br />
fuselage, wings and tail, if possible (typically, if a<br />
helicopter is used).<br />
۩ The offsets and misalignments between GPS, INS and the<br />
laser sensor must be known/measured on the ground<br />
before the flight which is accomplished with a validation<br />
flight.
In terms of data/coordinate transformation, <strong>ASPRS</strong> recommends to<br />
follow established requirements, which are stated in the NDEP Elevation<br />
Guidelines, and which says the following:<br />
“The North American Datum of 1983 (NAD 83) should be the default<br />
horizontal datum for all geospatial datasets of the United States. NAD 83<br />
is based on the Geodetic Reference System of 1980 (GRS 80) ellipsoid.<br />
However, it is necessary to remember that NAD 83 is nongeocentric by<br />
about 2.25 meters, while the latest version of WGS 84 is geocentric to a<br />
few centimeters. The official horizontal datum for military applications<br />
uses the WGS 84 ellipsoid.<br />
The North American Vertical Datum of 1988 (NAVD 88) should be the<br />
default vertical datum for all elevation datasets of the United States.<br />
To accurately convert elevations from GPS surveys into traditional<br />
orthometric heights, it is necessary to apply geoid height corrections as<br />
depicted in the latest geoid model of the area of interest. It is important<br />
that the latest geoid model be used for all surveys that involve GPS, and<br />
it is also important that the metadata for any digital elevation dataset<br />
include the geoid model that was used. For example, now that GEOID03<br />
is available, it is important to know whether GEOID03, GEOID99, or<br />
GEOID96 corrections were applied to an existing dataset to improve the<br />
accuracy of an old survey. However, it is critical to remember that<br />
overlapping geoid models (such as GEOID99 for the USA and GSD95 for<br />
Canada) generally disagree with one another, causing step-functions in<br />
any DEM that crosses the border. The military uses the WGS 84 geoid for<br />
all applications globally. Therefore, this system has no discontinuities at<br />
country borders or boundaries.
In the most common coordinate systems, the 3-D coordinates of any<br />
point are defined by a pair of horizontal coordinates plus a z-value that<br />
normally equates to its orthometric height. It is important that the<br />
horizontal coordinate system be specified clearly to avoid confusion. It is<br />
suggested to apply the most widely used coordinate systems.<br />
Universal Transverse Mercator (UTM) coordinates are normally preferred<br />
by (Federal) agencies responsible for large mapping programs<br />
nationwide. UTM is a planar coordinate system based on a uniform (and<br />
universal) Transverse Mercator grid that is the same for 60 UTM zones,<br />
each 6 degrees in longitude, worldwide. UTM coordinates are metric.<br />
Units should always be specified to include the number of decimal places<br />
used for meters. It is possible to specify UTM coordinates in meters and<br />
elevations in feet. X-coordinates are called "eastings" and Y-coordinates<br />
are called "northings." UTM scale factor errors are between 0.9996 and<br />
1.0004, i.e., four parts in 10,000. Scale factor errors are inevitable when<br />
warping a nearly spherical surface to map it on a gridded piece of paper<br />
configured as a plane, cylinder or cone.<br />
Each state has a unique State Plane Coordinate System (SPCS) that is<br />
tailored to the size and shape of the State so that scale factor errors are<br />
no larger than 1 part in 10,000, i.e., scale factor errors are between<br />
0.9999 and 1.0001. States longer in the north-south direction utilize one<br />
or more Transverse Mercator grid zones for their States. States longer in<br />
the east-west direction utilize one or more Lambert Conformal Conic grid<br />
zones. Some States (for example, Florida and New York) use both<br />
Transverse Mercator and Lambert Conformal Conic zones, and Alaska<br />
also uses an oblique projection for one zone. Some States (e.g.,<br />
Montana) chose to use only a single SPCS zone for convenience<br />
purposes, accepting scale factor errors larger than 1 part in 10,000.<br />
State plane coordinates are often expressed in U.S. survey feet,<br />
although some states use metric units. Units should always be specified,
to include the number of decimal places used for either feet or meters.<br />
As with UTM, State Plane X-coordinates are called "eastings" and Y-<br />
coordinates are called "northings." <strong>Horizontal</strong> coordinates can always be<br />
specified in terms of geographic coordinates, i.e., longitude and latitude<br />
instead of eastings and northings. There are no scale factor errors<br />
associated with geographic coordinates.<br />
DEMs may be produced with a uniform grid spacing (Δx = Δy) of 30<br />
meters, 10 meters, or 5 meters, for example, where easting and northing<br />
coordinates of DEM posts are typically specified by uniform x/y grid<br />
spacing based on a SPCS grid, a UTM grid, or an Albers equal area grid.<br />
Because such DEM points are equally spaced in x and y directions<br />
(eastings and northings), they can present edge-join difficulties at tile<br />
boundaries where convergence of the meridians cause rows to shorten in<br />
length at higher latitudes.<br />
DEMs may be produced with a consistent grid spacing of 1-arc-second<br />
(approximately 30 meters at the Equator), 1/3-arc-second<br />
(approximately 10 meters at the Equator), or 1/9-arc-second<br />
(approximately 3.3 meters at the Equator), for example, where Δx and<br />
Δy spacings between DEM posts are specified by consistent incremental<br />
changes in longitude and latitude. Because of convergence of the<br />
meridians, such DEM points will gradually come closer together at higher<br />
latitudes and physical, on-the-ground, post spacing in the east-west<br />
direction will be different than physical, on-the-ground post spacing in<br />
the north-south direction. A major advantage of the arc-second structure<br />
is that DEM tile edge-join difficulties are minimized or even eliminated.”
8. REFERENCES<br />
Publications<br />
Airborne 1 Corporation (2002). Lidar accuracy. Briefing Note BN#01, 12<br />
p. URL: (last accessed 20 February 2005)<br />
Alharthy, Abdullatif et el. (2004). Analysis and accuracy assessment of<br />
airborne laserscanning system. ISPRS XXth Congress, Commission 2,<br />
Istanbul, Turkey, 12-23 July 2004, 6 p.<br />
Amgaa, Tsolmon (2003). Wavelet-based analysis for object separation<br />
from laser altimetry data. PhD dissertation, International institute for<br />
geo-information science and earth observation enschede, The<br />
Netherlands, 60 p.<br />
Baltsavias, E.P. (1999). Airborne laser scanning: basic relations and<br />
formulas. ISPRS Journal of Photogrammetry & Remote Sensing 54<br />
(1999) 199–214, 16 p.<br />
Baltsavias, E.P. et el. (2001). Digital surface modeling by airborne laser<br />
scanning and digital photogrammetry for glacier monitoring.<br />
Photogrammetric Record, 17(98): 243-273 (October 2001), 16 p.<br />
Behan, A., Maas, H-G, and Vosselman, G (2000). Steps towards Quality<br />
Improvement of Airborne Laser Scanner Data. In Proceedings of the<br />
26th Annual Conference of the Remote Sensing Society, Leicester,<br />
September 12-14, 2000, 9 p.<br />
Blak, Timothy (2003). <strong>LIDAR</strong> <strong>Accuracy</strong> Assessment Report — Martin<br />
County. North Carolina Cooperating Technical State Flood Mapping<br />
Program, 11/7/2003, 6 p.<br />
Brown, K. (2003). Per-Pixel Uncertainty For Change Detection Using<br />
Airborne Data. Proceedings of the 7th International Conference on<br />
GeoComputation, University of Southampton, United Kingdom, 8 - 10<br />
September 2003 , 5 p.<br />
Byoung Kil Lee, Kiyun Yu, and Moowook Pyeon (2003). Effective<br />
Reduction of <strong>Horizontal</strong> Error in Laser Scanning Information by Strip-
Wise Least Squares Adjustments. ETRI Journal, Volume 25, Number 2,<br />
April 2003, 12 p.<br />
Campbell, Jacob et el. (2003). The application of lidar to synthetic vision<br />
system integrity. 22st Digital Avionics Systems Conference, October<br />
14-16, 2003, Indianapolis, IN, USA, 7 p.<br />
Carter, Bill et el. (2002). Airborne Laser Swath Mapping: Overview of<br />
Technology. 26 p., URL:<br />
http://www.ce.ufl.edu/nsf/Presentations/BillCarter/Carter.ppt (last<br />
accessed 20 February 2005)<br />
Casella, V. (1999). Estimating measurement precision by means of<br />
measurement differences. IAPRS, Vol. XXXII, Proceedings ISPRS WG<br />
VI/3 Workshop Mariano Cunietti Memorial Meeting, pp. 159-162, ISSN<br />
0256-1840, Parma, Italia, 15-19 February 1999, 4 p.<br />
Casella, V., Spalla, A. (2000). Estimation of planimetric accuracy of laser<br />
scanning data: Proposal of a method exploiting ramps. IAPRS, WG3/1,<br />
Vol. XXXIII, Amsterdam, 2000, 7 p.<br />
Casella, Vittorio (2001). <strong>Accuracy</strong> assessment of laser scanning data: a<br />
case study. 12 p., URL: http://www.inf.uni-<br />
konstanz.de/cgip/lehre/ss03-proj/papers/Casella01.pdf (last accessed<br />
20 February 2005)<br />
Chasmer, Laura and Hopkinson, Chris (2001). Using Airborne LASER<br />
Altimetry and GIS to Assess Scale-Induced Radiation Loading Errors in<br />
a Glacierised Basin. 58th Eastern snow conference, Ottawa, Ontario,<br />
Canada, 2001, 11 p.<br />
Conner, D. (2003). Lidar and Digital Elevation Data. North Carolina<br />
Floodplain Mapping Program, 6 p., URL:<br />
http://www.ncfloodmaps.com/pubdocs/lidar_final_jan03.pdf (last<br />
accessed 20 February 2005)<br />
Cooksey, Diana (2004). GPS <strong>Accuracy</strong>. PowerPoint-presentation, Montana<br />
State University, LRES Department, 28 August 2004, 26 p.
Digital photogrammetry: a major source of spatial data (2003). 15 p.,<br />
URL: http://www.earthmapping.com/pdf/slides/Digital-<br />
Photogrammetry.PDF (last accessed 20 February 2005)<br />
Everglades Restoration. Glossary of Terms and Acronyms. URL:<br />
http://www.evergladesplan.org/utilities/glossary.cfm (last accessed 30<br />
January 2005)<br />
FEMA (2002). Guidelines and Specifications for Flood Hazard Mapping<br />
Partners - Appendix A: Guidance for Aerial Mapping and Surveying. 59<br />
p.<br />
FEMA (2003). Guidelines and Specifications for Flood Hazard Mapping<br />
Partners - Acronyms and Abbreviations. 10 p.<br />
FEMA (2003). Guidelines and Specifications for Flood Hazard Mapping<br />
Partners – Glossary of Terms. 27 p.<br />
FGDC-STD-007.3-1998 (1998). Geospatial Positioning <strong>Accuracy</strong> Standards<br />
Part 3: National Standard for Spatial Data <strong>Accuracy</strong>. 28 p., URL:<br />
http://www.fgdc.gov/standards/documents/standards/accuracy/chapte<br />
r3.pdf (last accessed 20 February 2005)<br />
Frehlich, Rod and Kavaya, Michael (2002). Trade-off between Science<br />
Data Requirements and Lidar Engineering Designs. Universities Space<br />
Research Association, Laser Working Group workshop, Key West,<br />
Florida, USA, 23-25 January 2002, 19 p.<br />
Haala, N. and Brenner, C. (1999). Virtual City Models from Laser<br />
Altimeter and 2D Map Data. Journal of Photogrammetric Engineering &<br />
Remote Sensing 65(7), 787–795, 21 p., URL: www.ifp.uni-<br />
stuttgart.de/publications/1999/norbert_ohio.pdf (last accessed 20<br />
February 2005)<br />
Haala, N., Brenner, C. and Anders, K. (1998). 3D urban GIS from laser<br />
altimeter and 2D map data. ISPRS Vol. XXXII, 3/1, Columbus, Ohio,<br />
USA, pp. 339–346<br />
Herzig, A. et el. (2001). Renaturalization of Parts of the National Park<br />
Neusiedler See-Seewinkel/Fertö-Hansag by the Aid of Laser Scanning.<br />
In Proceedings of the Conference on GIS and Remote Sensing with
special emphasis on Monitoring World Heritage Sites, University of<br />
West Hungary, College of Surveying and Land Management, 06 - 08<br />
September 2001, 9 p.<br />
Hodgson, Michael and Bresnahan, Patrick (2004). <strong>Accuracy</strong> of Airborne<br />
Lidar-Derived Elevation: Empirical Assessment and Error Budget.<br />
Photogrammetric Engineering & Remote Sensing Vol. 70, No. 3, March<br />
2004, pp. 331–339 (10 p.)<br />
Hofmann, A. (2004). Analyses of TIN-structure parameter spaces in<br />
airborne laser scanner data for 3-D building model generation. ISPRS<br />
XXth Congress, Commission 2, Istanbul, Turkey, 12-23 July 2004, 6 p.<br />
Ingensand, Hilmar (2003). GPS and INS Integration with Kalman<br />
Filtering for Direct Georeferencing of Airborne Imagery. Geodetic<br />
seminar report, Institute of Geodesy and Photogrammetry, Zurich,<br />
Switzerland, 30 January 2003, 37 p.<br />
Jonas, David and Byrne, Peter (2003). Airborne Laser Scanning: Beyond<br />
Its Formative Years. Spatial Sciences 2003, Canberra, Australia, 23-25<br />
September 2003, 14 p.<br />
Katzenbeisser, Rolf (2003). About the calibration of lidar sensors. ISPRS<br />
Workshop “3-D Reconstruction from Airborne Laser-Scanner and InSAR<br />
data”, 8 – 10 October 2003, Dresden, Germany, 6 p.<br />
Kornus, W. and Ruiz, A. (2003). Strip adjustment of lidar data. ISPRS<br />
WG III/3 workshop on airborne laserscanning, “3-D reconstruction<br />
from airborne laserscanner and InSAR data”, 08 – 10 October 2003,<br />
Dresden, Germany, 4 p.<br />
Kurz, Sven (2005). <strong>Horizontal</strong> and vertical control of LiDAR data.<br />
Toposys’ technical note, 7 p.<br />
Lee, Impyeong and Choi, Yunsoo (2004). Fusion of terrestrial laser<br />
scanner data and images for building reconstruction. ISPRS XXth<br />
Congress, Commission 5, Istanbul, Turkey, 12-23 July 2004, 6 p.<br />
Lohmann, Peter and Koch, Andreas (1999). Quality Assessment of Laser-<br />
Scanner-Data. in Proceedings of ISPRS workshop "Sensors and
Mapping from Space 1999", Hannover, Germany, 27-30 September<br />
1999, 9 p.<br />
Luethy, J. and Ingensand, H. (2004). How to evaluate the quality of<br />
airborne laser scanning data. International Conference "Laser-<br />
Scanners for Forest and Landscape Assessment - Instruments,<br />
Processing Methods and Applications", 03 - 06 October 2004, Freiburg<br />
im Breisgau, Germany, 5 p.<br />
Maas, Hans-Gerd (2002). Methods for Measuring Height and Planimetry<br />
discrepancies in Airborne Laserscanner Data. Photogrammetric<br />
Engineering & Remote Sensing Vol. 68, No. 9, September 2002, pp.<br />
933–940 (8 p.)<br />
Maas, Hans-Gerd (2003). Planimetric and height accuracy of airborne<br />
laserscanner data: User requirements and system performance. 8 p.,<br />
URL: http://www.tu-<br />
dresden.de/fghgipf/forschung/material/publ2003/PhoWo03-Maas.pdf<br />
(last accessed 20 February 2005)<br />
McKeana, J., Roering, J. (2004). Objective landslide detection and<br />
surface morphology mapping using high-resolution airborne laser<br />
altimetry. Geomorphology 57 (2004) 331–351, Elsevier, 21 p.<br />
McKeana, Jim and Roering, Josh (2004). Operational <strong>Accuracy</strong> of Lidar in<br />
Mountainous Terrain. 68 p., URL:<br />
http://www.uoregon.edu/~jroering/outgoing/McKean_Lidar<strong>Accuracy</strong>20<br />
05.pdf (last accessed 20 February 2005)<br />
Merrick and Company (2003). Statement of Qualifications to Provide<br />
<strong>LIDAR</strong> Services. 18 p., URL:<br />
http://www.merrick.com/servicelines/gis/misc/<strong>LIDAR</strong>_SOQ_Internet.pd<br />
f (last accessed 20 February 2005)<br />
Merrick and Company (2004). Map accuracy standards – cross-reference.<br />
1 p., URL:<br />
http://www.merrick.com/servicelines/gis/misc/Merrick_<strong>Accuracy</strong>.pdf<br />
(last accessed 20 February 2005)
Minnesota Planning Land Management Information Center (1999).<br />
Positional <strong>Accuracy</strong> Handbook - Using the National Standard for<br />
Spatial Data <strong>Accuracy</strong> to measure and report geographic data quality.<br />
33 p., URL:<br />
http://www.mnplan.state.mn.us/pdf/1999/lmic/nssda_o.pdf (last<br />
accessed 20 February 2005)<br />
Morin, Kristian and El-Sheimy, Naser (2002). Post-mission Adjustment<br />
Methods of Airborne Laser Scanning Data. FIG XXII International<br />
Congress, Washington, D.C., USA, April 19-26 2002, 12 p.<br />
Morin, Kristian Walker (2002). Calibration of Airborne Laser Scanners.<br />
The Master’s theses, University of Calgary/Department of Geomatics<br />
Engineering, UCGE Reports number 20179, 134 p., URL:<br />
http://www.geomatics.ucalgary.ca/links/GradTheses.html (last<br />
accessed 30 January 2005)<br />
Maune, David (ed.) (2001). Digital Elevation Model Technologies and<br />
Applications: The DEM User Manaul. <strong>ASPRS</strong>, 2001, 539 p.<br />
Mosaic Mapping Systems, Inc. (2001). A White Paper on <strong>LIDAR</strong> Mapping.<br />
16 p., URL:<br />
http://www.mosaicmapping.com/Library/LidarWhitePaper.pdf (last<br />
accessed 20 February 2005)<br />
Mostafa, Mohamed (2001). Airborne Direct Georeferencing of Frame<br />
Imagery: An Error Budget. 3 rd International Symposium on Mobile<br />
Mapping Technology, Cairo, Egypt, January 3-5, 2001, 12 p.<br />
Mostafa, Mohamed (2001). Direct positioning and orientation systems<br />
how do they work? What is the attainable accuracy? In Proceedings of<br />
<strong>ASPRS</strong> Annual Meeting St. Louis, MO, USA, April 24-27, 2001, 11 p.<br />
Mostafa, Mohamed et al. (2000). Ground <strong>Accuracy</strong> from Directly<br />
Georeferenced Imagery Investigating the accuracy of<br />
GPS/Inertial/Photogrammetry. GIM International Vol.14 N.12<br />
December 2000, 4 p.<br />
NOAA (2004a). Digital Imagery Acquisition Requirements – Scope of<br />
work for shoreline mapping (draft v4). 19 February 2004, 18 p., URL:
http://www.ngs.noaa.gov/RSD/DigitalImagery_SOW_DRAFTv4.pdf (last<br />
accessed 20 February 2005)<br />
NOAA (2004b). Light Detection And Ranging (<strong>LIDAR</strong>) Requirements –<br />
Scope of work for shoreline mapping. 19 March 2004, 20 p., URL:<br />
http://www.ngs.noaa.gov/RSD/<strong>LIDAR</strong>_SOW_NGSMar2004.pdf (last<br />
accessed 20 February 2005)<br />
NOAA (2004c). Light Detection And Ranging (<strong>LIDAR</strong>) Requirements –<br />
Scope of work for airport surveying. 18 December 2004, 26 p., URL:<br />
http://www.ngs.noaa.gov/RSD/AirportSOW.pdf (last accessed 20<br />
February 2005)<br />
Raber, George (2003). The effect of lidar posting density on DEM<br />
accuracy and flood extent delineation: A GIS-simulation approach.<br />
University Consortium of Geographic Information Science (UCGIS)<br />
Summer Assembly 2003 in Pacific Grove, California, USA, 34 p.<br />
Rottensteiner, Franz et al. (2002). Lidar activities at the Viennese<br />
Institute of Photogrammetry and Remote Sensing. In Proceedings of<br />
the 3rd International <strong>LIDAR</strong> Workshop, "Mapping Geo-Surficial<br />
Processes Using Laser Altimetry", at the Ohio State University,<br />
Columbus, OH, October 7 - 9, 2002, 17 p.<br />
Saleh, Raad (2003). Survey protocol evaluation program. Final report<br />
June 17, 2003, Grand Canyon Monitoring Research Center, 51 p.<br />
Schäferb, A.G. and Locha, R.E.N. (2004). Application of airborne laser<br />
scanning in highway engineering projects in Brazil. ISPRS XXth<br />
Congress, Commission 3, Istanbul, Turkey, 12-23 July 2004, 6 p.<br />
Schnurr, Dan et el. (2004). Investigation, Assessment and Correction of<br />
Systematic Errors in Large LiDAR Datasets. RSPSoc/BGS two day<br />
meeting, Keyworth, United Kingdom, November 11-12, 2004, 13 p.<br />
Sekiguchi, Tatsuo and Sato, Hiroshi (). Application for Disaster<br />
Prevention Using Airborne Laser Scanning. Technical report 36,<br />
Geographical Survey Institute, Tokio, Japan, 6 p., URL:<br />
http://www.pwri.go.jp/eng/ujnr/joint/36/paper/91sekigu.pdf (last<br />
accessed 20 February 2005)
Souleyrette, Reginald (2003). Grade and Cross Slope Estimation from<br />
<strong>LIDAR</strong> based Surface Models. Iowa Department of Transportation,<br />
Final report CTRE Management Project 01-98, October 2003, 73 p.<br />
U.S. Air Force (1968). Principles of error theory and cartographic<br />
applications. Aeronautical Chart and Information Center Technical<br />
Report 68, 98 p. FTP:<br />
ftp://164.214.2.65/pub/gig/tr8400_1/tr8400_1.pdf (last accessed 20<br />
February 2005)<br />
U.S. Bureau of the Budget (1998). United States National Map <strong>Accuracy</strong><br />
Standards. 1 p.<br />
U.S. Department of the Interior (2003). NMAS mapping standards and<br />
some 2drms (95%) accuracies of GPS receiver's. National Park<br />
Service, AKSO GPSToolKit, 1 p., URL:<br />
http://www.nps.gov/gis/gps/aksogps/GenGPSToolKit03/Cheatsheets/m<br />
ap_stds.PDF (last accessed 20 February 2005)<br />
U.S. Department of Transportation (2003). Evaluating lidar for<br />
engineering design. Tech Brief of Research and Special Programs<br />
Administration, 2 p., URL:<br />
http://www.ncgia.ucsb.edu/ncrst/resources/easyread/Lidar<strong>Accuracy</strong>/Li<br />
dar<strong>Accuracy</strong>.pdf (last accessed 20 February 2005)<br />
USACE (2002). Engineering and Design - Photogrammetric Mapping,<br />
Appendix D - <strong>ASPRS</strong> <strong>Accuracy</strong> Standards for Large-Scale Maps. 3 p.,<br />
URL: http://www.usace.army.mil/usace-docs/eng-manuals/em1110-1-<br />
1000/a-d.pdf (last accessed 20 February 2005)<br />
USACE (2002). Engineering and Design - Photogrammetric Mapping,<br />
Chapter 11: Airborne <strong>LIDAR</strong> Topographic Surveying. Publication<br />
number EM 1110-1-1000. 12 p., URL:<br />
http://www.usace.army.mil/usace-docs/eng-manuals/em1110-1-<br />
1000/c-11.pdf (last accessed 20 February 2005)<br />
Whitman, D. Anderson, C. and Robertson, W.V. (2002). Airborne <strong>LIDAR</strong><br />
Data and Digital Elevation - Models in Broward County, Florida.
Windstorm Simulation & Modeling Project, International Hurricane<br />
Center, Florida International University, 14 p.<br />
Manual of Photogrammetry, Fifth edition (2004), Ch. 8: Cameras and<br />
Sensing Systems. pp. 581-676 (97 p.)<br />
Manual of Photogrammetry, Fifth edition (2004), Ch. 9: Photogrammetric<br />
Platforms. pp. 677-730 (55 p.)<br />
Manual of Photogrammetry, Fifth edition (2004), Ch. 13:<br />
Photogrammetric Products. pp. 983-1014 (33 p.)<br />
Manual of Photogrammetry, Fifth edition (2004), Ch. 14:<br />
Photogrammetric Applications. pp. 1015-1104 (90 p.)<br />
Manual of Photogrammetry, Fifth edition (2004), Ch. 15: Project and<br />
Mission Planning. pp. 1105-1123 (18 p.)
Web-sites (last accessed 20 February 2005)<br />
http://gis.esri.com/library/userconf/proc02/pap0442/p0442.htm<br />
http://www.aeromap.com/press14.htm<br />
http://www.airborne1.com<br />
http://www.ascehouston.org/newsletter/2004/May/lidar.htm<br />
http://www.colorado.edu/geography/gcraft/notes/error/error_ftoc.html<br />
http://www.colorado.edu/geography/gcraft/notes/manerror/manerror_f.h<br />
tml<br />
http://www.emporia.edu/earthsci/student/serr1/project.htm<br />
http://www.enerquest.com/rem-lidar-overview.html<br />
http://www.enerquest.com/rem-lidar-silc.html<br />
http://www.enerquest.com/rem-lidar-systems.html<br />
http://www.eomonline.com/Common/Archives/1997may/97may_gilbert.ht<br />
ml<br />
http://www.eomonline.com/Common/Archives/August00/birk.htm<br />
http://www.eomonline.com/Common/Archives/July00/robert.htm<br />
http://www.fema.gov/fhm/lidar_4b.shtm<br />
http://www.fema.gov/fhm/mm_a4b1t.shtm<br />
http://www.fema.gov/fhm/mm_a4b4.shtm<br />
http://www.fema.gov/fhm/mm_a4b7.shtm<br />
http://www.fema.gov/fhm/mm_a4b8.shtm<br />
http://www.fgdc.gov/standards/documents/standards/accuracy/chapter3.<br />
pdf<br />
http://www.fugro.com<br />
http://www.geoinsight.com/Knowledgebase/Standards/WhatIsNMAS.cfm<br />
http://www.geomatics.ucalgary.ca/links/GradTheses.html<br />
http://www.gisdevelopment.net/technology/gis/mi03129.htm<br />
http://www.gisdevelopment.net/technology/gis/mi03129a.htm<br />
http://www.horizonsinc.com/lidar.php<br />
http://www.infoterra-global.com/spotdems.htm<br />
http://www.merrick.com/servicelines/gis/lidaraccuracy.aspx
http://www.ndep.gov<br />
http://www.optech.ca<br />
http://www.toposys.com<br />
http://www.usace.army.mil/usace-docs/eng-manuals/em1110-1-1000/c-<br />
11.pdf
9. APPENDIX A: <strong>Horizontal</strong> accuracy assessment<br />
and the NSSDA standard
<strong>ASPRS</strong> LiDAR Guidelines <strong>Horizontal</strong> accuracy reporting 49<br />
Federal Geographic Data Committee FGDC-STD-007.3-1998<br />
Geospatial Positioning <strong>Accuracy</strong> Standards<br />
Part 3: National Standard for Spatial Data <strong>Accuracy</strong><br />
3.2 Testing Methodology And <strong>Reporting</strong> Requirements<br />
3.2.1 Spatial <strong>Accuracy</strong><br />
The NSSDA uses root-mean-square error (RMSE) to estimate positional accuracy. RMSE is the<br />
square root of the average of the set of squared differences between dataset coordinate values and<br />
1<br />
coordinate values from an independent source of higher accuracy for identical points .<br />
<strong>Accuracy</strong> is reported in ground distances at the 95% confidence level. <strong>Accuracy</strong> reported at the 95%<br />
confidence level means that 95% of the positions in the dataset will have an error with respect to true<br />
ground position that is equal to or smaller than the reported accuracy value. The reported accuracy<br />
value reflects all uncertainties, including those introduced by geodetic control coordinates,<br />
compilation, and final computation of ground coordinate values in the product.<br />
3.2.2 <strong>Accuracy</strong> Test Guidelines<br />
According to the Spatial Data Transfer Standard (SDTS) (ANSI-NCITS, 1998), accuracy testing by<br />
an independent source of higher accuracy is the preferred test for positional accuracy.<br />
Consequently, the NSSDA presents guidelines for accuracy testing by an independent source of<br />
higher accuracy. The independent source of higher accuracy shall the highest accuracy feasible and<br />
practicable to evaluate the accuracy of the dataset. 2<br />
The data producer shall determine the geographic extent of testing. <strong>Horizontal</strong> accuracy shall be<br />
3<br />
tested by comparing the planimetric coordinates of well-defined points in the dataset with<br />
coordinates of the same points from an independent source of higher accuracy. Vertical accuracy<br />
shall be tested by comparing the elevations in the dataset with elevations of the same points as<br />
determined from an independent source of higher accuracy.<br />
Errors in recording or processing data, such as reversing signs or inconsistencies between the dataset<br />
and independent source of higher accuracy in coordinate reference system definition, must be<br />
corrected before computing the accuracy value.<br />
A minimum of 20 check points shall be tested, distributed to reflect the geographic area of interest<br />
4<br />
and the distribution of error in the dataset. When 20 points are tested, the 95% confidence level<br />
allows one point to fail the threshold given in product specifications.<br />
1<br />
2<br />
3<br />
4<br />
Writer: Andre Samberg<br />
Status: review<br />
see Appendix 3-A<br />
see Appendix 3-C, section 2<br />
see Appendix 3-C, section 1<br />
see Appendix 3-C, section 3<br />
3-4<br />
draft ver. 0.9<br />
comments: info@avaproedu.com 2005-03-07
<strong>ASPRS</strong> LiDAR Guidelines <strong>Horizontal</strong> accuracy reporting 50<br />
Federal Geographic Data Committee FGDC-STD-007.3-1998<br />
Geospatial Positioning <strong>Accuracy</strong> Standards<br />
Part 3: National Standard for Spatial Data <strong>Accuracy</strong><br />
If fewer than twenty points can be identified for testing, use an alternative means to evaluate the<br />
accuracy of the dataset. SDTS (ANSI-NCITS, 1998) identifies these alternative methods for<br />
determining positional accuracy:<br />
Deductive Estimate<br />
Internal Evidence<br />
3.2.3 <strong>Accuracy</strong> <strong>Reporting</strong><br />
Comparison to Source<br />
Spatial data may be compiled to comply with one accuracy value for the vertical component and<br />
another for the horizontal component. If a dataset does not contain elevation data, label for<br />
horizontal accuracy only. Conversely, when a dataset, e.g. a gridded digital elevation dataset or<br />
elevation contour dataset, does not contain well-defined points, label for vertical accuracy only.<br />
A dataset may contain themes or geographic areas that have different accuracies. Below are<br />
guidelines for reporting accuracy of a composite dataset:<br />
If data of varying accuracies can be identified separately in a dataset, compute and report<br />
separate accuracy values.<br />
If data of varying accuracies are composited and cannot be separately identified AND the<br />
dataset is tested, report the accuracy value for the composited data.<br />
If a composited dataset is not tested, report the accuracy value for the least accurate dataset<br />
component.<br />
Positional accuracy values shall be reported in ground distances. Metric units shall be used when<br />
the dataset coordinates are in meters. Feet shall be used when the dataset coordinates are in feet.<br />
The number of significant places for the accuracy value shall be equal to the number of significant<br />
places for the dataset point coordinates.<br />
<strong>Accuracy</strong> reporting in ground distances allows users to directly compare datasets of differing scales<br />
or resolutions. A simple statement of conformance (or omission, when a map or dataset is nonconforming)<br />
is not adequate in itself. Measures based on map characteristics, such as publication<br />
scale or contour interval, are not longer adequate when data can be readily manipulated and output<br />
to any scale or to different data formats.<br />
Report accuracy at the 95% confidence level for data tested for both horizontal and vertical accuracy<br />
as:<br />
Writer: Andre Samberg<br />
Status: review<br />
Tested ____ (meters, feet) horizontal accuracy at 95% confidence level<br />
____ (meters, feet) vertical accuracy at 95% confidence level<br />
3-5<br />
draft ver. 0.9<br />
comments: info@avaproedu.com 2005-03-07
<strong>ASPRS</strong> LiDAR Guidelines <strong>Horizontal</strong> accuracy reporting 51<br />
Federal Geographic Data Committee FGDC-STD-007.3-1998<br />
Geospatial Positioning <strong>Accuracy</strong> Standards<br />
Part 3: National Standard for Spatial Data <strong>Accuracy</strong><br />
Use the “compiled to meet” statement below when the above guidelines for testing by an independent<br />
source of higher accuracy cannot be followed and an alternative means is used to evaluate accuracy.<br />
Report accuracy at the 95% confidence level for data produced according to procedures that have<br />
been demonstrated to produce data with particular horizontal and vertical accuracy values as:<br />
Compiled to meet ____ (meters, feet) horizontal accuracy at 95% confidence level<br />
____ (meters, feet) vertical accuracy at 95% confidence level<br />
Report accuracy for data tested for horizontal accuracy and produced according to procedures that<br />
have been demonstrated to comply with a particular vertical accuracy value as:<br />
Tested ____ (meters, feet) horizontal accuracy at 95% confidence level<br />
Compiled to meet ____ (meters, feet) vertical accuracy at 95% confidence level<br />
Show similar labels when data are tested for vertical accuracy and produced according to procedures<br />
that have been demonstrated to produce data with a particular horizontal accuracy value.<br />
For digital geospatial data, report the accuracy value in digital geospatial metadata (Federal<br />
Geographic Data Committee, 1998, Section 2), as appropriate to dataset spatial characteristics:<br />
(Data_Quality_Information/Positional_<strong>Accuracy</strong>/<strong>Horizontal</strong>_Positional_<strong>Accuracy</strong>/<strong>Horizontal</strong>_Po<br />
sitional_<strong>Accuracy</strong>_Assessment/<strong>Horizontal</strong>_Positional_<strong>Accuracy</strong>_Value)<br />
and/or<br />
(Data_Quality_Information/Positional_<strong>Accuracy</strong>/Vertical_Positional_<strong>Accuracy</strong>/Vertical_Position<br />
al_<strong>Accuracy</strong>_Assessment/Vertical_Positional_<strong>Accuracy</strong>_Value)<br />
Enter the text “National Standard for Spatial Data <strong>Accuracy</strong>” for these metadata elements (Federal<br />
Geographic Data Committee, 1998, Section 2), as appropriate to dataset spatial characteristics:<br />
(Data_Quality_Information/Positional_<strong>Accuracy</strong>/<strong>Horizontal</strong>_Positional_<strong>Accuracy</strong>/<strong>Horizontal</strong>_Po<br />
sitional_<strong>Accuracy</strong>_Assessment/<strong>Horizontal</strong>_Positional_<strong>Accuracy</strong>_Explanation)<br />
and/or<br />
(Data_Quality_Information/Positional_<strong>Accuracy</strong>/Vertical_Positional_<strong>Accuracy</strong>/Vertical_Position<br />
al_<strong>Accuracy</strong>_Assessment/Vertical_Positional_<strong>Accuracy</strong>_Explanation)<br />
Regardless of whether the data was tested by a independent source of higher accuracy or evaluated<br />
for accuracy by alternative means, provide a complete description on how the values were determined<br />
in metadata, as appropriate to dataset spatial characteristics (Federal Geographic Data Committee,<br />
1998, Section 2):<br />
(Data_Quality_Information/Positional_<strong>Accuracy</strong>/<strong>Horizontal</strong>_Positional_<strong>Accuracy</strong>/<strong>Horizontal</strong>_Po<br />
sitional_<strong>Accuracy</strong>_Report)<br />
and/or<br />
(Data_Quality_Information/Positional_<strong>Accuracy</strong>/Vertical_Positional_<strong>Accuracy</strong>/Vertical_Position<br />
al_<strong>Accuracy</strong>_Report)<br />
Writer: Andre Samberg<br />
Status: review<br />
3-6<br />
draft ver. 0.9<br />
comments: info@avaproedu.com 2005-03-07
<strong>ASPRS</strong> LiDAR Guidelines <strong>Horizontal</strong> accuracy reporting 52<br />
Federal Geographic Data Committee FGDC-STD-007.3-1998<br />
Geospatial Positioning <strong>Accuracy</strong> Standards<br />
Part 3: National Standard for Spatial Data <strong>Accuracy</strong><br />
3.3 NSSDA and Other Map <strong>Accuracy</strong> Standards<br />
<strong>Accuracy</strong> of new or revised spatial data will be reported according to the NSSDA. <strong>Accuracy</strong> of<br />
existing or legacy spatial data and maps may be reported, as specified, according to the NSSDA or<br />
the accuracy standard by which they were evaluated. Appendix 3-D describes root mean square<br />
error (RMSE) as applied to individual x-, y- components, former NMAS, and <strong>ASPRS</strong> <strong>Accuracy</strong><br />
Standards for Large-Scale Maps. These standards, their relationships to NSSDA, and accuracy<br />
labeling are described to ensure that users have some means to assess positional accuracy of spatial<br />
data or maps for their applications.<br />
If accuracy reporting cannot be provided using NSSDA or other recognized standards, provide<br />
information to enable users to evaluate how the data fit their applications requirements. This<br />
information may include descriptions of the source material from which the data were compiled,<br />
accuracy of ground surveys associated with compilation, digitizing procedures, equipment, and<br />
quality control procedures used in production.<br />
No matter what method is used to evaluate positional accuracy, explain the accuracy of coordinate<br />
measurements and describe the tests in digital geospatial metadata (Federal Geographic Data<br />
Committee, 1998, Section 2) , as appropriate to dataset spatial characteristics:<br />
(Data_Quality_Information/Positional_<strong>Accuracy</strong>/<strong>Horizontal</strong>_Positional_<strong>Accuracy</strong>/<strong>Horizontal</strong>_Po<br />
sitional_<strong>Accuracy</strong>_Report)<br />
and/or<br />
(Data_Quality_Information/Positional_<strong>Accuracy</strong>/Vertical_Positional_<strong>Accuracy</strong>/Vertical_Position<br />
al_<strong>Accuracy</strong>_Report)<br />
Provide information about the source data and processes used to produce the dataset in data elements<br />
of digital geospatial metadata (Federal Geographic Data Committee, 1998, Section 2) under<br />
(Data_Quality_Information/Lineage).<br />
Writer: Andre Samberg<br />
Status: review<br />
3-7<br />
draft ver. 0.9<br />
comments: info@avaproedu.com 2005-03-07
<strong>ASPRS</strong> LiDAR Guidelines <strong>Horizontal</strong> accuracy reporting 53<br />
Federal Geographic Data Committee FGDC-STD-007.3-1998<br />
Geospatial Positioning <strong>Accuracy</strong> Standards<br />
Part 3: National Standard for Spatial Data <strong>Accuracy</strong><br />
Appendix 3-A (normative): <strong>Accuracy</strong> Statistics<br />
EXPLANATORY COMMENTS<br />
1. <strong>Horizontal</strong> <strong>Accuracy</strong><br />
Let:<br />
RMSE = sqrt[ (x - x ) /n]<br />
x data, i check, i 2<br />
RMSE = sqrt[ (y - y ) /n]<br />
y data, i check, i 2<br />
where:<br />
x data, i, y data, i are the coordinates of the i th check point in the dataset<br />
x check, i, y check, i are the coordinates of the i th check point in the independent source of higher<br />
accuracy<br />
n is the number of check points tested<br />
i is an integer ranging from 1 to n<br />
2 2<br />
<strong>Horizontal</strong> error at point i is defined as sqrt[(x data, i - x check, i) +(y data, i - y check, i)<br />
]. <strong>Horizontal</strong> RMSE<br />
is:<br />
2 2<br />
RMSE r = sqrt[ ((x data, i - x check, i) +(y data, i - y check, i)<br />
)/n]<br />
2 2<br />
= sqrt[RMSE x + RMSE y ]<br />
Case 1: Computing <strong>Accuracy</strong> According to the NSSDA when RMSE = RMSE<br />
x y<br />
If RMSE = RMSE ,<br />
x y<br />
2 2<br />
RMSE r = sqrt(2*RMSE x ) = sqrt(2*RMSE y )<br />
= 1.4142*RMSE = 1.4142*RMSE<br />
x y<br />
It is assumed that systematic errors have been eliminated as best as possible. If error is normally<br />
distributed and independent in each the x- and y-component and error, the factor 2.4477 is used to<br />
compute horizontal accuracy at the 95% confidence level (Greenwalt and Schultz, 1968). When the<br />
preceding conditions apply, <strong>Accuracy</strong> r , the accuracy value according to NSSDA, shall be computed<br />
by the formula:<br />
Writer: Andre Samberg<br />
Status: review<br />
<strong>Accuracy</strong> r = 2.4477 * RMSE x = 2.4477 * RMSEy<br />
= 2.4477 * RMSE r /1.4142<br />
<strong>Accuracy</strong> r = 1.7308 * RMSEr<br />
3-10<br />
draft ver. 0.9<br />
comments: info@avaproedu.com 2005-03-07
<strong>ASPRS</strong> LiDAR Guidelines <strong>Horizontal</strong> accuracy reporting 54<br />
Federal Geographic Data Committee FGDC-STD-007.3-1998<br />
Geospatial Positioning <strong>Accuracy</strong> Standards<br />
Part 3: National Standard for Spatial Data <strong>Accuracy</strong><br />
Appendix 3-A (normative): <strong>Accuracy</strong> Statistics<br />
Case 2: Approximating circular standard error when RMSE RMSE<br />
x y<br />
If RMSE /RMSE is between 0.6 and 1.0 (where RMSE is the smaller value between RMSE<br />
min max min x<br />
and RMSE and RMSE is the larger value), circular standard error (at 39.35% confidence) may<br />
y max<br />
be approximated as 0.5*(RMSE + RMSE ) (Greenwalt and Schultz, 1968). If error is normally<br />
x y<br />
distributed and independent in each the x- and y-component and error, the accuracy value according<br />
to NSSDA may be approximated according to the following formula:<br />
2. Vertical <strong>Accuracy</strong><br />
Let:<br />
<strong>Accuracy</strong> ~ 2.4477 * 0.5 * (RMSE + RMSE )<br />
r x y<br />
RMSE = sqrt[ (z - z ) /n]<br />
z data i check i 2<br />
where<br />
z data i is the vertical coordinate of the i th check point in the dataset.<br />
z check i is the vertical coordinate of the i th check point in the independent source of higher accuracy<br />
n = the number of points being checked<br />
i is an integer from 1 to n<br />
It is assumed that systematic errors have been eliminated as best as possible. If vertical error is<br />
normally distributed, the factor 1.9600 is applied to compute linear error at the 95% confidence level<br />
(Greenwalt and Schultz, 1968). Therefore, vertical accuracy, <strong>Accuracy</strong> z,<br />
reported according to the<br />
NSSDA shall be computed by the following formula:<br />
Writer: Andre Samberg<br />
Status: review<br />
<strong>Accuracy</strong> = 1.9600 *RMSE .<br />
z z<br />
3-11<br />
draft ver. 0.9<br />
comments: info@avaproedu.com 2005-03-07
<strong>ASPRS</strong> LiDAR Guidelines <strong>Horizontal</strong> accuracy reporting 55<br />
Federal Geographic Data Committee FGDC-STD-007.3-1998<br />
Geospatial Positioning <strong>Accuracy</strong> Standards<br />
Part 3: National Standard for Spatial Data <strong>Accuracy</strong><br />
Appendix 3-C (informative): Testing guidelines<br />
Writer: Andre Samberg<br />
Status: review<br />
Appendix 3-C.<br />
Testing guidelines<br />
(informative)<br />
3-16<br />
draft ver. 0.9<br />
comments: info@avaproedu.com 2005-03-07
<strong>ASPRS</strong> LiDAR Guidelines <strong>Horizontal</strong> accuracy reporting 56<br />
Federal Geographic Data Committee FGDC-STD-007.3-1998<br />
Geospatial Positioning <strong>Accuracy</strong> Standards<br />
Part 3: National Standard for Spatial Data <strong>Accuracy</strong><br />
Appendix 3-C (informative): Testing guidelines<br />
1. Well-Defined Points<br />
A well-defined point represents a feature for which the horizontal position is known to a high<br />
degree of accuracy and position with respect to the geodetic datum. For the purpose of accuracy<br />
testing, well-defined points must be easily visible or recoverable on the ground, on the<br />
independent source of higher accuracy, and on the product itself. Graphic contour data and<br />
digital hypsographic data may not contain well-defined points.<br />
The selected points will differ depending on the type of dataset and output scale of the dataset.<br />
For graphic maps and vector data, suitable well-defined points represent right-angle intersections<br />
of roads, railroads, or other linear mapped features, such as canals, ditches, trails, fence lines,<br />
and pipelines. For orthoimagery, suitable well-defined points may represent features such as<br />
small isolated shrubs or bushes, in addition to right-angle intersections of linear features. For<br />
map products at scales of 1:5,000 or larger, such as engineering plats or property maps, suitable<br />
well-defined points may represent additional features such as utility access covers and<br />
intersections of sidewalks, curbs, or gutters.<br />
2. Data acquisition for the independent source of higher accuracy<br />
The independent source of higher accuracy shall be acquired separately from data used in the<br />
aerotriangulation solution or other production procedures. The independent source of higher<br />
accuracy shall be of the highest accuracy feasible and practicable to evaluate the accuracy of the<br />
dataset.<br />
Although guidelines given here are for geodetic ground surveys, the geodetic survey is only one<br />
of many possible ways to acquire data for the independent source of higher accuracy. Geodetic<br />
control surveys are designed and executed using field specifications for geodetic control surveys<br />
(Federal Geodetic Control Committee, 1984). <strong>Accuracy</strong> of geodetic control surveys is evaluated<br />
using Part 2, Standards for Geodetic Networks (Federal Geographic Data Committee, 1998). To<br />
evaluate if the accuracy of geodetic survey is sufficiently greater than the positional accuracy<br />
value given in the product specification, compare the FGCS network accuracy reported for the<br />
geodetic survey with the accuracy value given by the product specification for the dataset.<br />
Other possible sources for higher accuracy information are Global Positioning System (GPS)<br />
ground surveys, photogrammetric methods, and data bases of high accuracy point coordinates.<br />
3. Check Point Location<br />
Due to the diversity of user requirements for digital geospatial data and maps, it is not realistic to<br />
include statements in this standard that specify the spatial distribution of check points. Data<br />
and/or map producers must determine check point locations. This section provides guidelines for<br />
distributing the check point locations.<br />
Check points may be distributed more densely in the vicinity of important features and more<br />
sparsely in areas that are of little or no interest. When data exist for only a portion of the dataset,<br />
confine test points to that area. When the distribution of error is likely to be nonrandom, it may<br />
Writer: Andre Samberg<br />
Status: review<br />
3-17<br />
draft ver. 0.9<br />
comments: info@avaproedu.com 2005-03-07
<strong>ASPRS</strong> LiDAR Guidelines <strong>Horizontal</strong> accuracy reporting 57<br />
Federal Geographic Data Committee FGDC-STD-007.3-1998<br />
Geospatial Positioning <strong>Accuracy</strong> Standards<br />
Part 3: National Standard for Spatial Data <strong>Accuracy</strong><br />
Appendix 3-C (informative): Testing guidelines<br />
be desirable to locate check points to correspond to the error distribution.<br />
For a dataset covering a rectangular area that is believed to have uniform positional accuracy,<br />
check points may be distributed so that points are spaced at intervals of at least 10 percent of the<br />
diagonal distance across the dataset and at least 20 percent of the points are located in each<br />
quadrant of the dataset.<br />
Writer: Andre Samberg<br />
Status: review<br />
3-18<br />
draft ver. 0.9<br />
comments: info@avaproedu.com 2005-03-07
<strong>ASPRS</strong> LiDAR Guidelines <strong>Horizontal</strong> accuracy reporting 58<br />
Federal Geographic Data Committee FGDC-STD-007.3-1998<br />
Geospatial Positioning <strong>Accuracy</strong> Standards<br />
Part 3: National Standard for Spatial Data <strong>Accuracy</strong><br />
Appendix 3-D (informative): Other <strong>Accuracy</strong> Standards<br />
Writer: Andre Samberg<br />
Status: review<br />
Appendix 3-D.<br />
Other <strong>Accuracy</strong> Standards<br />
(informative)<br />
3-19<br />
draft ver. 0.9<br />
comments: info@avaproedu.com 2005-03-07
<strong>ASPRS</strong> LiDAR Guidelines <strong>Horizontal</strong> accuracy reporting 59<br />
Federal Geographic Data Committee FGDC-STD-007.3-1998<br />
Geospatial Positioning <strong>Accuracy</strong> Standards<br />
Part 3: National Standard for Spatial Data <strong>Accuracy</strong><br />
Appendix 3-D (informative): Other <strong>Accuracy</strong> Standards<br />
1. Root-Mean-Square Error (RMSE) Component <strong>Accuracy</strong><br />
1.1 Relationship between NSSDA (horizontal) and RMSE (x or y)<br />
From Appendix 3-A, Section 1, assuming RMSE x = RMSE y and error is normally distributed and<br />
independent in each the x- and y-component, RMSE x and RMSE y can be estimated from RMSEr<br />
using:<br />
RMSE = RMSE = RMSE /1.4142<br />
x y r<br />
Using the same assumptions, RMSE and RMSE can also be computed from <strong>Accuracy</strong> , the<br />
x y r<br />
accuracy value according to NSSDA:<br />
RMSE = RMSE = <strong>Accuracy</strong> /2.4477<br />
x y r<br />
1.2 Relationship between NSSDA (vertical) and RMSE (vertical)<br />
From Appendix 3-A, Section 2, if vertical error is normally distributed, RMSE can be<br />
z<br />
determined from <strong>Accuracy</strong> , vertical accuracy reported according to the NSSDA:<br />
z<br />
RMSE = <strong>Accuracy</strong> /1.9600<br />
z z<br />
1.3 RMSE <strong>Accuracy</strong> <strong>Reporting</strong><br />
Label data or maps as described in Section 3.2.3, "<strong>Accuracy</strong> <strong>Reporting</strong>," but substitute "RMSE"<br />
for "accuracy at 95% confidence level." For horizontal accuracy, provide separate statements for<br />
each RMSE component.<br />
For digital geospatial metadata, follow the guidelines for preparing metadata in Section 3.2.3,<br />
"<strong>Accuracy</strong> <strong>Reporting</strong>," but substitute “Root-Mean-Square Error” for “National Standard for<br />
Spatial Data <strong>Accuracy</strong>” for these metadata elements (Federal Geographic Data Committee, 1998,<br />
Section 2), as appropriate to dataset spatial characteristics:<br />
(Data_Quality_Information/Positional_<strong>Accuracy</strong>/<strong>Horizontal</strong>_Positional_<strong>Accuracy</strong>/<strong>Horizontal</strong>_Po<br />
sitional_<strong>Accuracy</strong>_Assessment/<strong>Horizontal</strong>_Positional_<strong>Accuracy</strong>_Explanation)<br />
and/or<br />
(Data_Quality_Information/Positional_<strong>Accuracy</strong>/Vertical_Positional_<strong>Accuracy</strong>/Vertical_Position<br />
al_<strong>Accuracy</strong>_Assessment/Vertical_Positional_<strong>Accuracy</strong>_Explanation)<br />
Writer: Andre Samberg<br />
Status: review<br />
3-20<br />
draft ver. 0.9<br />
comments: info@avaproedu.com 2005-03-07
<strong>ASPRS</strong> LiDAR Guidelines <strong>Horizontal</strong> accuracy reporting 60<br />
Federal Geographic Data Committee FGDC-STD-007.3-1998<br />
Geospatial Positioning <strong>Accuracy</strong> Standards<br />
Part 3: National Standard for Spatial Data <strong>Accuracy</strong><br />
Appendix 3-D (informative): Other <strong>Accuracy</strong> Standards<br />
2. Former National Map <strong>Accuracy</strong> Standards (NMAS)<br />
2.1 Relationship between NSSDA and NMAS (horizontal)<br />
NMAS (U.S. Bureau of the Budget, 1947) specifies that 90% of the well-defined points that are<br />
tested must fall within a specified tolerance:<br />
For map scales larger than 1:20,000, the NMAS horizontal tolerance is 1/30 inch,<br />
measured at publication scale.<br />
For map scales of 1:20,000 or smaller, the NMAS horizontal tolerance is 1/50 inch,<br />
measured at publication scale.<br />
If error is normally distributed in each the x- and y-component and error for the x-component is<br />
equal to and independent of error for the y-component, the factor 2.146 is applied to compute<br />
circular error at the 90% confidence level (Greenwalt and Schultz, 1968). The circular map<br />
accuracy standard (CMAS) based on NMAS is:<br />
CMAS = 2.1460 * RMSE x = 2.1460 * RMSEy<br />
= 2.1460 * RMSE r /1.4142<br />
= 1.5175 * RMSE r<br />
The CMAS can be converted to accuracy reported according to NSSDA, <strong>Accuracy</strong> , using<br />
r<br />
equations from Appendix 3-A, Section 1:<br />
<strong>Accuracy</strong> = 2.4477/2.1460 * CMAS = 1.1406 * CMAS.<br />
r<br />
Therefore, NMAS horizontal accuracy reported according to the NSSDA is:<br />
1.1406* [S * (1/30")/12"] feet, or 0.0032 * S, for map scales larger than 1:20,000<br />
1.1406* [S * (1/50")/12"] feet, or 0.0019 * S, for map scales of 1:20,000 or smaller<br />
where S is the map scale denominator.<br />
2.2 Relationship between NSSDA and NMAS (vertical)<br />
NMAS (U.S. Bureau of the Budget, 1947) specifies the maximum allowable vertical tolerance to<br />
be one half the contour interval, at all contour intervals. If vertical error is normally distributed,<br />
the factor 1.6449 is applied to compute vertical accuracy at the 90% confidence level (Greenwalt<br />
and Schultz, 1968). Therefore, the Vertical Map <strong>Accuracy</strong> Standard (VMAS) based on NMAS<br />
is estimated by the following formula:<br />
Writer: Andre Samberg<br />
Status: review<br />
VMAS = 1.6449 * RMSEz<br />
3-21<br />
draft ver. 0.9<br />
comments: info@avaproedu.com 2005-03-07
<strong>ASPRS</strong> LiDAR Guidelines <strong>Horizontal</strong> accuracy reporting 61<br />
Federal Geographic Data Committee FGDC-STD-007.3-1998<br />
Geospatial Positioning <strong>Accuracy</strong> Standards<br />
Part 3: National Standard for Spatial Data <strong>Accuracy</strong><br />
Appendix 3-D (informative): Other <strong>Accuracy</strong> Standards<br />
The VMAS can be converted to <strong>Accuracy</strong> , accuracy reported according to the NSSDA using<br />
z<br />
equations from Appendix 3-A, Section 2:<br />
<strong>Accuracy</strong> = 1.9600/1.6449 * VMAS = 1.1916 * VMAS.<br />
z<br />
Therefore, vertical accuracy reported according to the NSSDA is (1.1916)/2 * CI = 0.5958 * CI,<br />
where CI is the contour interval.<br />
2.3 NMAS <strong>Reporting</strong><br />
Map labels provide a statement of conformance with NMAS, rather than reporting the accuracy<br />
value. Label maps, as appropriate to dataset spatial characteristics:<br />
This map complies with National Map <strong>Accuracy</strong> Standards of 1947 for horizontal<br />
accuracy<br />
OR<br />
This map complies with National Map <strong>Accuracy</strong> Standards of 1947 for vertical<br />
accuracy<br />
OR<br />
This map complies with National Map <strong>Accuracy</strong> Standards of 1947 for horizontal and<br />
vertical accuracy<br />
For digital geospatial data evaluated by the NMAS, follow the guidelines for preparing metadata<br />
in Section 3.2.3, "<strong>Accuracy</strong> <strong>Reporting</strong>," but substitute “U.S. National Map <strong>Accuracy</strong> Standards of<br />
1947" for “National Standard for Spatial Data <strong>Accuracy</strong>” for these metadata elements (Federal<br />
Geographic Data Committee, 1998, Section 2), as appropriate to dataset spatial characteristics:<br />
(Data_Quality_Information/Positional_<strong>Accuracy</strong>/<strong>Horizontal</strong>_Positional_<strong>Accuracy</strong>/<strong>Horizontal</strong>_Po<br />
sitional_<strong>Accuracy</strong>_Assessment/<strong>Horizontal</strong>_Positional_<strong>Accuracy</strong>_Explanation)<br />
and/or<br />
(Data_Quality_Information/Positional_<strong>Accuracy</strong>/Vertical_Positional_<strong>Accuracy</strong>/Vertical_Position<br />
al_<strong>Accuracy</strong>_Assessment/Vertical_Positional_<strong>Accuracy</strong>_Explanation)<br />
3. American Society for Photogrammetry and Remote Sensing (<strong>ASPRS</strong>) <strong>Accuracy</strong> Standards for<br />
Large-Scale Maps<br />
3.1 Explanation of <strong>ASPRS</strong> <strong>Accuracy</strong> Standards for Large-Scale Maps<br />
<strong>ASPRS</strong> <strong>Accuracy</strong> Standards for Large-Scale Maps (<strong>ASPRS</strong> Specifications and Standards<br />
Committee, 1990) provide accuracy tolerances for maps at 1:20,000-scale or larger “prepared for<br />
special purposes or engineering applications.” RMSE is the statistic used by the <strong>ASPRS</strong><br />
standards. <strong>Accuracy</strong> is reported as Class 1, Class 2, or Class 3. Class 1 accuracy for horizontal<br />
and vertical components is discussed below. Class 2 accuracy applies to maps compiled within<br />
limiting RMSE’s twice those allowed for Class 1 maps. Similarly, Class 3 accuracy applies to<br />
Writer: Andre Samberg<br />
Status: review<br />
3-22<br />
draft ver. 0.9<br />
comments: info@avaproedu.com 2005-03-07
<strong>ASPRS</strong> LiDAR Guidelines <strong>Horizontal</strong> accuracy reporting 62<br />
Federal Geographic Data Committee FGDC-STD-007.3-1998<br />
Geospatial Positioning <strong>Accuracy</strong> Standards<br />
Part 3: National Standard for Spatial Data <strong>Accuracy</strong><br />
Appendix 3-D (informative): Other <strong>Accuracy</strong> Standards<br />
3.4 <strong>ASPRS</strong> <strong>Accuracy</strong> Standards for Large-Scale Maps <strong>Reporting</strong><br />
Maps evaluated according to <strong>ASPRS</strong> <strong>Accuracy</strong> Standards for Large-Scale Maps are labeled by a<br />
conformance statement, rather than a numeric accuracy value.<br />
Label maps produced according to this standard:<br />
THIS MAP WAS COMPILED TO MEET THE <strong>ASPRS</strong><br />
STANDARD FOR CLASS (1., 2., 3.) MAP ACCURACY<br />
Label maps checked and found to confirm to this standard:<br />
Writer: Andre Samberg<br />
Status: review<br />
THIS MAP WAS CHECKED AND FOUND TO CONFORM<br />
TO THE <strong>ASPRS</strong><br />
STANDARD FOR CLASS (1., 2., 3.) MAP ACCURACY<br />
3-25<br />
draft ver. 0.9<br />
comments: info@avaproedu.com 2005-03-07
<strong>ASPRS</strong> LiDAR Guidelines <strong>Horizontal</strong> accuracy reporting 63<br />
NDEP Guidelines for Digital Elevation Data<br />
Part 1 Content<br />
Table 1 User Requirements Menu<br />
General Surface Description (choose one or more)<br />
Elevation Surface (1.2.1) Elevation Type (choose one) (1.2.2)<br />
Digital surface model (first reflective surface) Orthometric height<br />
Digital terrain model (bare earth) Ellipsoid height<br />
Bathymetric surface Point cloud Other ________________<br />
Mixed surface<br />
Model Types (1.3) (choose one or more) * Designate either feet or meters<br />
Mass points Grid (post spacing = ___ feet/meters) * Contour interval = _____ft /m *<br />
Breaklines Grid (post spacing = ____ arc-seconds) Cross Sections<br />
TIN (average point spacing = ___ feet/meters) * Other (For example, concurrent<br />
image capture)<br />
Source (1.4) (choose one)<br />
Cartographic Photographic IFSAR <strong>LIDAR</strong> Sonar<br />
If Multi-return system:<br />
First return Last return All returns<br />
Vertical <strong>Accuracy</strong> (1.5.1.1) (choose one)<br />
Fundamental Vertical <strong>Accuracy</strong>z = __ (ft or meters) at 95 percent confidence level in open terrain = RMSEz x<br />
1.9600<br />
Supplemental Vertical <strong>Accuracy</strong>z = __ (ft or meters) = 95th percentile in other specified land cover categories<br />
Consolidated Vertical <strong>Accuracy</strong>z = __ (ft or meters) = 95th percentile in all land cover categories combined<br />
<strong>Horizontal</strong> <strong>Accuracy</strong> (1.5.1.2) (choose one)<br />
<strong>Accuracy</strong>r = ___ ft or meters<br />
<strong>Horizontal</strong> accuracy at the 95 percent confidence level (<strong>Accuracy</strong>r) = RMSEr x 1.7308<br />
Surface Treatment Factors (1.5.4) (optional – refer to the text)<br />
Hydrography Artifacts<br />
Man-made structures Special Surfaces<br />
Special earthen surfaces<br />
<strong>Horizontal</strong> Datum (1.6.1) (choose one) Vertical Datum (1.6.2) (choose one)<br />
NAD 83 (default) NAVD 88 (default) MSL<br />
WGS 84 MLLW Other _____<br />
Geoid Model (1.6.3) (choose one) GEOID03 Other _____<br />
Coordinate System (1.7) UTM zone ______ State Plane zone ______<br />
(choose one) Geographic Other _____<br />
Units (1.7) Note: For feet and meters, vertical (V) units may differ from horizontal (H) units<br />
Feet to ___ decimal places V H Decimal degrees to ___ decimal places<br />
Meters to ___ decimal places V H DDDMMSS to ___ decimal places<br />
Feet are assumed to be U.S. Survey Feet unless specified to the contrary<br />
Data Format (1.8) (Specify desired format(s) for each Product Type. See text for examples.)<br />
Product 1 ______________________ Formats __________________________________________________<br />
Product 2 ______________________ Formats __________________________________________________<br />
Product 3 ______________________ Formats __________________________________________________<br />
File size (1.9) (specify acceptable range) ___________ Mb / Gb / Other _________<br />
File Extent<br />
Boundary: ____________Rectangular________________ _________NonRectangular__________<br />
x-dimension _____ m / ft. / degrees / other ___ Bndry name ______________________<br />
y-dimension _____ m / ft. / degrees / other ___ Coordinate source _________________<br />
Over-edge buffer width: _____________________________<br />
Metadata compliant to the “Content Standards for Digital Geospatial Metadata” is highly<br />
recommended.<br />
Writer: Andre Samberg<br />
Status: review<br />
8<br />
draft ver. 0.9<br />
comments: info@avaproedu.com 2005-03-07