coastal wetland mapping using time series sar imagery and ... - asprs
coastal wetland mapping using time series sar imagery and ... - asprs
coastal wetland mapping using time series sar imagery and ... - asprs

Create successful ePaper yourself
Turn your PDF publications into a flip-book with our unique Google optimized e-Paper software.
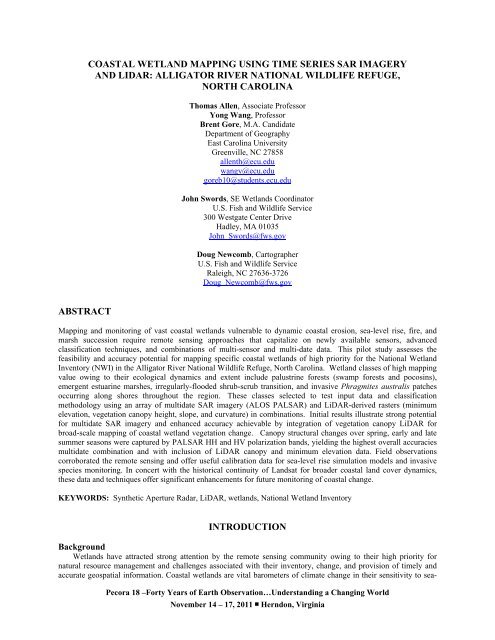
ABSTRACT<br />
COASTAL WETLAND MAPPING USING TIME SERIES SAR IMAGERY<br />
AND LIDAR: ALLIGATOR RIVER NATIONAL WILDLIFE REFUGE,<br />
NORTH CAROLINA<br />
Thomas Allen, Associate Professor<br />
Yong Wang, Professor<br />
Brent Gore, M.A. C<strong>and</strong>idate<br />
Department of Geography<br />
East Carolina University<br />
Greenville, NC 27858<br />
allenth@ecu.edu<br />
wangy@ecu.edu<br />
goreb10@students.ecu.edu<br />
John Swords, SE Wetl<strong>and</strong>s Coordinator<br />
U.S. Fish <strong>and</strong> Wildlife Service<br />
300 Westgate Center Drive<br />
Hadley, MA 01035<br />
John_Swords@fws.gov<br />
Doug Newcomb, Cartographer<br />
U.S. Fish <strong>and</strong> Wildlife Service<br />
Raleigh, NC 27636-3726<br />
Doug_Newcomb@fws.gov<br />
Mapping <strong>and</strong> monitoring of vast <strong>coastal</strong> <strong>wetl<strong>and</strong></strong>s vulnerable to dynamic <strong>coastal</strong> erosion, sea-level rise, fire, <strong>and</strong><br />
marsh succession require remote sensing approaches that capitalize on newly available sensors, advanced<br />
classification techniques, <strong>and</strong> combinations of multi-sensor <strong>and</strong> multi-date data. This pilot study assesses the<br />
feasibility <strong>and</strong> accuracy potential for <strong>mapping</strong> specific <strong>coastal</strong> <strong>wetl<strong>and</strong></strong>s of high priority for the National Wetl<strong>and</strong><br />
Inventory (NWI) in the Alligator River National Wildlife Refuge, North Carolina. Wetl<strong>and</strong> classes of high <strong>mapping</strong><br />
value owing to their ecological dynamics <strong>and</strong> extent include palustrine forests (swamp forests <strong>and</strong> pocosins),<br />
emergent estuarine marshes, irregularly-flooded shrub-scrub transition, <strong>and</strong> invasive Phragmites australis patches<br />
occurring along shores throughout the region. These classes selected to test input data <strong>and</strong> classification<br />
methodology <strong>using</strong> an array of multidate SAR <strong>imagery</strong> (ALOS PALSAR) <strong>and</strong> LiDAR-derived rasters (minimum<br />
elevation, vegetation canopy height, slope, <strong>and</strong> curvature) in combinations. Initial results illustrate strong potential<br />
for multidate SAR <strong>imagery</strong> <strong>and</strong> enhanced accuracy achievable by integration of vegetation canopy LiDAR for<br />
broad-scale <strong>mapping</strong> of <strong>coastal</strong> <strong>wetl<strong>and</strong></strong> vegetation change. Canopy structural changes over spring, early <strong>and</strong> late<br />
summer seasons were captured by PALSAR HH <strong>and</strong> HV polarization b<strong>and</strong>s, yielding the highest overall accuracies<br />
multidate combination <strong>and</strong> with inclusion of LiDAR canopy <strong>and</strong> minimum elevation data. Field observations<br />
corroborated the remote sensing <strong>and</strong> offer useful calibration data for sea-level rise simulation models <strong>and</strong> invasive<br />
species monitoring. In concert with the historical continuity of L<strong>and</strong>sat for broader <strong>coastal</strong> l<strong>and</strong> cover dynamics,<br />
these data <strong>and</strong> techniques offer significant enhancements for future monitoring of <strong>coastal</strong> change.<br />
KEYWORDS: Synthetic Aperture Radar, LiDAR, <strong>wetl<strong>and</strong></strong>s, National Wetl<strong>and</strong> Inventory<br />
INTRODUCTION<br />
Background<br />
Wetl<strong>and</strong>s have attracted strong attention by the remote sensing community owing to their high priority for<br />
natural resource management <strong>and</strong> challenges associated with their inventory, change, <strong>and</strong> provision of <strong>time</strong>ly <strong>and</strong><br />
accurate geospatial information. Coastal <strong>wetl<strong>and</strong></strong>s are vital barometers of climate change in their sensitivity to sea-<br />
Pecora 18 –Forty Years of Earth Observation…Underst<strong>and</strong>ing a Changing World<br />
November 14 – 17, 2011 ■ Herndon, Virginia
level rise, role in the global carbon cycle, <strong>and</strong> their provision of biodiversity <strong>and</strong> buffers, both in terms of nutrient<br />
cyles in estuaries <strong>and</strong> abatement of storm surges <strong>and</strong> <strong>coastal</strong> erosion. Difficulties arising in regional inventory <strong>and</strong><br />
synoptic coverage of <strong>wetl<strong>and</strong></strong>s, however, are imposing. In particular, very high thematic <strong>and</strong> spatial resolution are<br />
frequently sought, such as for environmental impact or ecological management, <strong>and</strong> regional <strong>and</strong> national programs<br />
for monitoring <strong>wetl<strong>and</strong></strong>s have tended to restrict their map production to traditional aerial photointerpretation, such as<br />
the US Fish <strong>and</strong> Wildlife Service’s National Wetl<strong>and</strong> Inventory (NWI.) In addition to capturing species-related<br />
vegetation associations <strong>and</strong> zonation, several authors have noted the fundamental hydrologic dynamics of <strong>wetl<strong>and</strong></strong>s<br />
compound these problems, inducing corresponding temporal complexity to their optical signatures <strong>and</strong> sub-canopy<br />
structure (e.g., Kasischke <strong>and</strong> Borgeau-Chavez 1997.) Multidate <strong>and</strong> multi-source data are thus increasingly sought<br />
to disentangle these sources of possible confusion to <strong>mapping</strong> <strong>and</strong> inventorying programs <strong>using</strong> remote sensing,<br />
especially where areas of study are vast or inaccessible. Such problem-reducing approaches may include hydrology<br />
in the classification product, such as hydrogeomorphic classification (Hamilton et al., 2007) or the use of image<br />
classification techniques such as spectral unmixing to discern fractional composition of <strong>wetl<strong>and</strong></strong>s (e.g., Rogers <strong>and</strong><br />
Kearney, 2004.) Geospatial analysis <strong>and</strong> hydrologic simulation modeling may also be adapted to provide<br />
complementary input data for classification, such as the use of floodplain inundation models (Townsend <strong>and</strong> Walsh,<br />
1998) <strong>and</strong> has a history of success at improving forest classification in complex topographic environments (c.f.,<br />
Franklin 1991.)<br />
The emerging capabilities of an array of Synthetic Aperture Radar (SAR) <strong>and</strong> Light Detection <strong>and</strong> Ranging<br />
(LiDAR) sensors has attracted research exp<strong>and</strong>ing the possibilities to further overcome difficulties of <strong>coastal</strong><br />
<strong>mapping</strong> <strong>and</strong> change detection. ERS-1 SAR <strong>imagery</strong> has provided a successful means to map hydrologic<br />
associations of vegetation in the Everglades <strong>and</strong> to monitor changes in hydroperiod over a regional scale (Borgeau-<br />
Chavez <strong>and</strong> Kasischke 2005.) New sensors <strong>and</strong> application of noise <strong>and</strong> speckle-suppression image filtering<br />
techniques have also met with successes for <strong>coastal</strong> <strong>wetl<strong>and</strong></strong> <strong>mapping</strong>. For example, Kushwaha et al. (2000)<br />
evaluated several filters for noise reduction to <strong>time</strong> <strong>series</strong> ERS-1 SAR data. Intensity-hue-saturation analysis of the<br />
multidate ERS-1 data also revealed improved <strong>wetl<strong>and</strong></strong> discrimination, particularly in combination with Indian<br />
Remote Sensing Satellite (IRSS) sensor data when compared to SAR-only data. In addition, C-b<strong>and</strong> SAR <strong>imagery</strong><br />
have been applied to <strong>mapping</strong> forested <strong>wetl<strong>and</strong></strong>s, a challenging vegetation assemblage for multispectral or singlesource<br />
remote sensing <strong>imagery</strong>. In their multitemporal analysis of ERS-2, ENVISAT ASAR, <strong>and</strong> L<strong>and</strong>sat Enhanced<br />
Thematic Mapper Plus (ETM+), Lang et al. (2008) were able to demonstrate success of empirical Principal<br />
Components Analysis (PCA) to delineate hydroperiod-related classes of forested <strong>wetl<strong>and</strong></strong>s in the Mid-Atlantic,<br />
USA. Time <strong>series</strong> remote sensing <strong>and</strong> change detection are also exploiting seasonal, interannual, <strong>and</strong> phonologic<br />
changes in surfaces (Lunetta <strong>and</strong> Elvidge, 1998.) Multisensor SAR <strong>imagery</strong> over a period of twelve years was also<br />
able to detect <strong>coastal</strong> <strong>wetl<strong>and</strong></strong> shoreline change <strong>using</strong> edge-detecting filters with JERS-1 <strong>and</strong> Advanced L<strong>and</strong><br />
Observation Satellite (ALOS) Phased-Array L-b<strong>and</strong> SAR (PALSAR) <strong>imagery</strong> in the Pamlico Sound, North Carolina<br />
(Wang <strong>and</strong> Allen, 2008.)<br />
Remote sensing, field, <strong>and</strong> environmental modeling data stored <strong>and</strong> analyzed within Geographic Information<br />
Systems (GIS) have played a strong <strong>and</strong> increasing role <strong>wetl<strong>and</strong></strong> <strong>mapping</strong>, such as the provision of floodplain<br />
boundaries <strong>and</strong> frequency of inundation simulations (Coe 2000.) Hydrogeomorphic conditions dominate the<br />
environmental gradients of riverine <strong>and</strong> <strong>coastal</strong> <strong>wetl<strong>and</strong></strong>s, affecting their biodiversity patterns (Hupp 1988) <strong>and</strong><br />
zonation that can be discerned via remote sensing <strong>and</strong> environmental simulations of hydrology. Digital shoreline<br />
data, mapped via field, boat, or aerial <strong>imagery</strong> sources, is frequently used to mask aquatic <strong>and</strong> terrestrial zones for<br />
simplification of <strong>coastal</strong> remote sensing problems. Multisensor data can also be valuable, such as the utilization of<br />
<strong>imagery</strong> with infra-red reflectance data to rapidly map shorelines <strong>and</strong> develop mask layers for l<strong>and</strong>-water separation.<br />
In addition, Light Detection <strong>and</strong> Ranging (LiDAR) has emerged as a revolutionary data source for <strong>mapping</strong> dynamic<br />
l<strong>and</strong>forms <strong>and</strong> water levels (Hofle et al. 2009.) As the multitude of potential remote sensing data sources,<br />
algorithms, <strong>and</strong> classifications grows, it is prudent to expose potential methods <strong>and</strong> products to scrutiny <strong>and</strong> rigorous<br />
accuracy assessment. Several comprehensive past <strong>and</strong> ongoing remote sensing products have demonstrated useful<br />
insights from well-thought feasibility, prototyping, <strong>and</strong> accuracy assessments, including the NOAA Coastal Change<br />
Analysis Program (C-CAP) (Jensen et al., 1993), CoastWatch (Dobson <strong>and</strong> Bright, 1991; Klemas 1993), <strong>and</strong> USGS<br />
North American L<strong>and</strong>scape Characterization (NALC) archive (Lovel<strong>and</strong> et al., 2000.)<br />
Objectives. Our project aimed to assess the feasibility <strong>and</strong> achievable accuracy for multidate Synthetic Aperture<br />
Radar (SAR) <strong>and</strong> integrated RS-GIS data to classify <strong>coastal</strong> <strong>wetl<strong>and</strong></strong>s with high thematic <strong>and</strong> spatial resolution<br />
analogous to the US Fish <strong>and</strong> Wildlife Service’s National Wetl<strong>and</strong> Inventory (NWI) in a pilor study area of <strong>coastal</strong><br />
North Carolina. We specifically intend to reveal the capability <strong>and</strong> accuracy of ALOS PALSAR <strong>and</strong> LiDAR input<br />
data combinations (e.g., SAR-only, combined SAR <strong>and</strong> LiDAR, <strong>and</strong> permutations of derivative LiDAR minimum<br />
elevation, vegetation canopy height, <strong>and</strong> slope.) Target thematic classes include palustrine forested <strong>wetl<strong>and</strong></strong>s<br />
Pecora 18 –Forty Years of Earth Observation…Underst<strong>and</strong>ing a Changing World<br />
November 14 – 17, 2011 ■ Herndon, Virginia
(pocosins, swamp forests, <strong>and</strong> pond pine forested shrubl<strong>and</strong>), shrub-scrub <strong>wetl<strong>and</strong></strong> thickets, estuarine emergent<br />
<strong>wetl<strong>and</strong></strong>s (salt <strong>and</strong> brackish marshes), <strong>and</strong> patches of invasive Phragmites australis shores routinely establishing on<br />
the estuarine fringe of the Pamlico Sound.<br />
Study Area<br />
The selected study area for this pilot project (Figure<br />
1.) includeds the <strong>coastal</strong> marshes of the US Fish <strong>and</strong><br />
Wildlife (FWS) Alligator River National Wildlife<br />
Refuge (ARNWR), located along the shore of the<br />
Croatan <strong>and</strong> Pamlico Sounds in eastern North Carolina.<br />
The remote site exhibits few vehicular passable roads<br />
<strong>and</strong> extensive mosaics of pocosin <strong>and</strong> swamp forests,<br />
shrub-scrub, <strong>and</strong> emergent brackish <strong>and</strong> salt marshes, as<br />
well as sporadic patches of Phragmites. The region is<br />
representative of low-lying <strong>coastal</strong> plain swamp <strong>and</strong><br />
marshl<strong>and</strong>s, including the situation of the micro-tidal<br />
inundation regime dominated by infrequent wind tides.<br />
Thick peat soils <strong>and</strong> deep artificial ditches pose<br />
logistical limits on cropl<strong>and</strong>, forestry, <strong>and</strong> human<br />
settlements. The study area is approximately 20Km<br />
north-south <strong>and</strong> 10Km wide east-west along the<br />
Croatan-Pamlico Sounds on the eastern shore of the<br />
Pamlico Peninsula. The area was also selected owing to<br />
availability of prior FWS NWI <strong>mapping</strong> (ca. 1983) <strong>and</strong><br />
METHODS<br />
Figure 1. Study area location, Alligator River National<br />
Wildlife Refuge, North Carolina.<br />
ongoing updates in spring <strong>and</strong> summer 2010. The area would serve as the first of two areas selected, initially this<br />
site for methodology development, accuracy assessment <strong>and</strong> calibration. Subsequently, a second phase of analysis<br />
on performance <strong>and</strong> criticality of product <strong>and</strong> results will be undertake <strong>and</strong> reported later for sites in Swan Quarter<br />
<strong>and</strong>/or Cedar Isl<strong>and</strong> National Wildlife Refuges.<br />
Data Acquisition <strong>and</strong><br />
Preprocessing<br />
The study searched the data holdings of<br />
the Japanese Aerospace Exploration<br />
Agency (JAXA) <strong>and</strong> Alaska Satellite<br />
Facility (the relevant ground receiving<br />
station for the region) to procure a <strong>time</strong><br />
<strong>series</strong> of ALOS PALSAR <strong>imagery</strong>.<br />
Three scenes were identified <strong>and</strong><br />
acquired for 2010 images of PALSAR Lb<strong>and</strong><br />
HH <strong>and</strong> HV polarization SAR: 1)<br />
40 April 2010, 2) 15 June 2010, <strong>and</strong> 3)<br />
15 September 2010. This year coincided<br />
with near-normal precipitation <strong>and</strong><br />
temperature regimes during the springsummer<br />
seasons. In addition, LiDAR<br />
data were acquired for the area from the<br />
N.C. Floodplain Mapping Program for<br />
Figure 2. PALSAR multidate images April, June, <strong>and</strong> September 2010.<br />
2002, <strong>and</strong> digital aerial orthophotography<br />
was obtained from March-April 2010 for the area from the NC repository of the US Department of Agriculture<br />
National Agricultural Imagery Program (NAIP) (true-color composites.) PALSAR data were checked for<br />
georectification accuracy against the NAIP <strong>imagery</strong> <strong>and</strong> LiDAR, <strong>and</strong> each image was converted from digital number<br />
Pecora 18 –Forty Years of Earth Observation…Underst<strong>and</strong>ing a Changing World<br />
November 14 – 17, 2011 ■ Herndon, Virginia
(DN) into radar backscatter coefficient<br />
(measured in dB) as reported by Wang<br />
<strong>and</strong> Allen (2008.) All data were<br />
reprojected <strong>and</strong> resampled with nearestneighbor<br />
analysis to Universal<br />
Transverse Mercator-194 (WGS84) for<br />
common earth coordinate system. Nonadapted<br />
speckle filters were applied to<br />
reduce noise in the PALSAR data,<br />
ultimately with selection of a 3x3 median<br />
filter in order to preserve step edges <strong>and</strong><br />
ecotones between potential vegetation<br />
zones. This technique would reduce<br />
isolated pulses <strong>and</strong> yet provide a<br />
systematic method for subsequent<br />
analysis in other areas without the need to<br />
adjust adaptive filter weights (Tso <strong>and</strong><br />
Mather, 2001.) LiDAR data included Figure 3. LiDAR derived (a) DEM <strong>and</strong> (b) vegetation canopy height.<br />
previously developed digital surface<br />
models, resampled to 3m resolution digital elevation models (DEMs.) In addition, while last-return LiDAR points<br />
were developed for the bare earth DEM used in floodplain <strong>mapping</strong> <strong>and</strong> hydrologic modeling, we also acquired a<br />
vegetation canopy height DEM based on the first-return LiDAR points (D. Newcomb, personal communication.)<br />
Slope, profile, <strong>and</strong> planform curvature were derived for the bare earth DEM as potential input layers for<br />
classification <strong>using</strong> ArcGIS10 <strong>and</strong> GRASS GIS. A master raster database was constructed with potential inputs for<br />
image classification: 1-6) SAR HH <strong>and</strong> HV backscatter coefficients for the three image dates (Figure 2); 7) bare<br />
earth LiDAR-derived DEM; 8) slope; 9-10) DEM planform <strong>and</strong> profile curvature; <strong>and</strong> 11) LiDAR first-return<br />
vegetation canopy height surface. LiDAR bare earth DEM <strong>and</strong> vegetation canopy height are illustrated in Figure 3<br />
(a <strong>and</strong> b, respectively.) The range of elevations is 0-6m, while vegetation canopy ranges 0-20m.<br />
Image Classification<br />
Our method for image classification subdivided the image subset into four combinations of data: 1) SAR-only,<br />
including HH <strong>and</strong> HV b<strong>and</strong>s; 2) SAR plus LiDAR DEM; 3) SAR with canopy height; <strong>and</strong> SAR with DEM <strong>and</strong><br />
canopy height. Preliminary analysis of the slope <strong>and</strong> curvature images resulted in gross errors, a result of the limited<br />
topographic relief for the area (most slopes < 1 degree <strong>and</strong> only isolated, rare instances of measureable slope<br />
curvature.) We employed ISODATA unsupervised classification as a first order technique for evaluating potential<br />
discernibility among key vegetation classes including, palustrine forest, shrub-scrub, estuarine emergent marshes,<br />
<strong>and</strong> Phragmites. We also evaluated variable number of clusters (10, 15, <strong>and</strong> 20), <strong>and</strong> convergence thresholds, <strong>and</strong><br />
the adoption of a water mask (precluding open water from entering the classification.) One image analyst conducted<br />
each of the image classifications, utilizing the 2010 provisional NWI aerial photointerpreted vegetation map as a<br />
guide, along with ground photos <strong>and</strong> field expert knowledge. A separate image analyst conducted the accuracy<br />
assessment, utilizing NAIP <strong>imagery</strong> <strong>and</strong> field observations <strong>and</strong> expertise of an on-site ecologist.<br />
Accuracy Assessment<br />
Accuracy assessment sought to evaluate a variety of quality characteristics of the produced maps, including<br />
Producer’s, User’s, <strong>and</strong> overall accuracy, as well as deriving the Kappa (K-hat) coefficient as a comparative statistic<br />
to other potential classification techniques <strong>and</strong> products. Owing to the inaccessibility <strong>and</strong> potential to require<br />
ground-based observational verification, we subdivided the classified images into three intensive study areas (ISAs),<br />
centered on Spencer Creek (an estuarine creek to the north, fronting Croatan Sound), Point Peter Road (site of an<br />
ecological restoration project by The Nature Conservancy, <strong>and</strong> one of the few roads transecting most vegetation<br />
units), <strong>and</strong> Stumpy Point (a community in the south of the area, fronting Pamlico Sound, with several points of<br />
vehicular <strong>and</strong> foot transit.) For each image, 300 test points were sampled in a stratified r<strong>and</strong>om technique utilizing a<br />
3x3 majority threshold for pixel selection (Threshold=7). This potentially positively biased criterion was sought to<br />
mitigate errors that might be imparted from the variable spatial positional accuracy of both reference verification<br />
data <strong>and</strong> input SAR <strong>and</strong> DEM data. 2010 NWI maps, 2010 color orthophotography, <strong>and</strong> field observations were<br />
utilized to label test pixel reference values while the classified categories were blind to the analyst. Error matrices,<br />
accuracy percentages, <strong>and</strong> overall accuracy <strong>and</strong> Kappa statistics were generated for each attempt.<br />
Pecora 18 –Forty Years of Earth Observation…Underst<strong>and</strong>ing a Changing World<br />
November 14 – 17, c 2011 ■ Herndon, Virginia d
Results of the image classification are<br />
shown in map form in Figure 4 a-d, depicting<br />
the overall mosaic of classes. The SAR-only<br />
classification (4a) performed exceptionally<br />
well qualitatively with respect to marsh, shrubscrub,<br />
<strong>and</strong> palustrine forest extent <strong>and</strong> pattern<br />
(overall Kappa 0.742). The SAR-only<br />
classification yielded an overall accuracy of<br />
80.7% with relatively high user’s accuracy by<br />
class (lowest for water with 63.3% while<br />
vegetation ranged 71.9% for shrub-scrub to<br />
89.7% for marshes.) The SAR <strong>and</strong> DEM<br />
classification (4b) identified an overabundance<br />
of Phragmites, particularly in the Spencer<br />
Creek north area (overall Kappa 0.52). The<br />
SAR+DEM combination suffered low accuracy<br />
with Phragmites (user’s accuracy 42.8%) <strong>and</strong><br />
marshes (54.4%), likely as a fundamental<br />
result of low-lying fringe vegetation being<br />
indetermine for interpolated bare earth LiDAR<br />
points. SAR <strong>and</strong> canopy height classification<br />
(4c) is visually good, with moderate error in<br />
overestimating the extent of Phragmites <strong>and</strong><br />
open water within Spencer Creek (Kappa =<br />
0.726). SAR+canopy height classified data<br />
was superior to SAR+DEM, with better<br />
Phragmites results (user’s accuracy 61.1%)<br />
<strong>and</strong> much improved shrub-scrub accuracy<br />
(72.8%.) Finally, the SAR <strong>imagery</strong> with DEM<br />
<strong>and</strong> canopy height included resulted in a good<br />
overall upl<strong>and</strong> classification <strong>and</strong> modest error,<br />
visually, among the water <strong>and</strong> Phragmites.<br />
This image (4d) nonetheless identified forest <strong>and</strong><br />
schrub-scrub discernment very well (Kappa<br />
overall 0.744). The overall accuracy for this<br />
composite classification <strong>using</strong> SAR, DEM, <strong>and</strong><br />
vegetation canopy height was 81.33%, with a<br />
surprising disappointment with confusion of<br />
RESULTS AND DISCUSSION<br />
c d<br />
water (60% user’s accuracy). This result is nonetheless very promising, as incorporating a more robust shoreline<br />
water mask or infrared-based spectral mask would dramatically reduce this source of confusion (found mianly with<br />
commission errors, water being classified as Phragmites.) However, it is equally possible that Phragmites is so<br />
dynamic in this area, that is in truth was present at the <strong>time</strong> <strong>imagery</strong> was collected. Our field visit with FWS staff<br />
<strong>and</strong> on-site ecologists from The Nature Conservancy (TNC) revealed that the some large areas of Phragmities had<br />
just been sprayed by aerial application of herbicides. As a result, the interpretation that open water was not this type<br />
vegetation could be in error. Other vegetation was not sprayed, buoying our inference that this initial methodology<br />
<strong>and</strong> combination of data sources could provide a robust <strong>and</strong> effective method for <strong>coastal</strong> <strong>wetl<strong>and</strong></strong> <strong>mapping</strong>.<br />
CONCLUSIONS<br />
a b<br />
Figure 4. Results of four image classifications a) SAR-only, b)<br />
SAR with DEM, c) SAR with canopy height, <strong>and</strong> d) SAR with<br />
DEM <strong>and</strong> canopy height.<br />
Although results reported in this project are preliminary, we suggest that the literature <strong>and</strong> convergence of SAR,<br />
LiDAR, <strong>and</strong> geospatial analysis are now mature to the point that heretofore methods for regional <strong>wetl<strong>and</strong></strong><br />
inventorying <strong>and</strong> <strong>mapping</strong> are highly promising. This project has shown that good accuracy <strong>and</strong> even high user’s<br />
Pecora 18 –Forty Years of Earth Observation…Underst<strong>and</strong>ing a Changing World<br />
November 14 – 17, 2011 ■ Herndon, Virginia
accuracy can be generated from the combination of multidate SAR <strong>and</strong> LiDAR. The relatively good accuracy <strong>and</strong><br />
inexpensive source <strong>imagery</strong> (ALOS PALSAR) should spur future such missions for <strong>coastal</strong> <strong>mapping</strong>, <strong>and</strong> the<br />
application of LiDAR beyond its original floodplain <strong>mapping</strong> purposes illustrates a strong value-addition to <strong>coastal</strong><br />
resource <strong>and</strong> environmental managers. A surprising <strong>and</strong> further promising result was the relatively good accuracy<br />
achieved for Phragmites class, particularly in the SAR-only <strong>time</strong> <strong>series</strong> classification (85.7% user’s accuracy.)<br />
Conservatively, however, the second phase of this research remains to be undertaken, the best data combinations <strong>and</strong><br />
classification algorithms will be applied to a second test area as an evaluation of the portability <strong>and</strong> robustness of the<br />
approach.<br />
REFERENCES<br />
Borgeau-Chavez, L.L., K.B. Smith, S.M., Brunzell, E.S. Kasischke, E.A. Romanowicz, <strong>and</strong> C.J. Richardson, 2005.<br />
Remote sensing of regional inundation patterns <strong>and</strong> hydroperiod in the Greater Everglades <strong>using</strong> synthetic<br />
aperture radar. Wetl<strong>and</strong>s, 25(1):176-191.<br />
Coe, M.T., 2000. Modeling terrestrial hydrologic systems at the continental scale: Testing the accuracy of an<br />
atmospheric GCM. Journal of Climate, 13:686-704.<br />
Dobson, J.D. <strong>and</strong> E.A. Bright, 1991. CoastWatch- Detecting Change in Coastal Wetl<strong>and</strong>s. Geo Info Systems,<br />
January, 36-40.<br />
Franklin, S.E., 1991. Satellite remote sensing of mountain geomorphic surfaces, Canadian Journal of Remote<br />
Sensing, 17(3):218-229.<br />
Hamilton, S.K., J. Kellndorfer, B. Lehner, <strong>and</strong> M. Tobler, 2007. Remote sensing of floodplain geomorphology as a<br />
surrogate for biodiversity in a tropical river system (Madre de Dios, Peru.), Geomorphology, 89:23-38.<br />
Hofle, B., M. Vetter, N. Pfeiffer, G. M<strong>and</strong>lburger, <strong>and</strong> J. Stotter, 2009. Water surface <strong>mapping</strong> from airborne laser<br />
scanning <strong>using</strong> signal intensity <strong>and</strong> elevation data. Earth Surface Processes <strong>and</strong> L<strong>and</strong>forms, 34(12):1635-<br />
1649.<br />
Hupp, C.R., 1988. Plant ecological aspects of flood geomorphology <strong>and</strong> paleoflood history. In: Baker, V.R., Kochel,<br />
C.R., Patton, R.C. (Eds.), Flood Geomorphology, Wiley, pp. 335-356.<br />
Jensen, J.R., D. Cowen, J.D. Althausen, S. Narumalani, <strong>and</strong> O. Weatherbee. 1993. An evaluation of CoastWatch<br />
change detection protocol in South Carolina. Photogrammetric Engineering <strong>and</strong> Remote Sensing, 59(6):<br />
1039-1046.<br />
Kasischke, E.L. <strong>and</strong> L.L. Borgeau-Chavez. 1997. Monitoring south Florida <strong>wetl<strong>and</strong></strong>s <strong>using</strong> ERS-1 SAR <strong>imagery</strong>.<br />
Photogrammetry <strong>and</strong> Remote Sensing, 63:281-291.<br />
Klemas, V.V., J.E. Dobson, R.L. Ferguson, <strong>and</strong> K.D. Haddad. 1993. A <strong>coastal</strong> l<strong>and</strong> cover classification system for<br />
the NOAA Coastwatch Change Analysis Project. Journal of Coastal Research, 9(3): 862-872<br />
Kushwaha, S.P.S., R.S. Dwivedi, <strong>and</strong> B.R.M. Rao. 2000. Evaluation of various digital image processing techniques<br />
for detection of <strong>coastal</strong> <strong>wetl<strong>and</strong></strong>s <strong>using</strong> ERS-1 SAR data. International Journal of Remote Sensing,<br />
21(3):565-579.<br />
Lang, M.W., E.S. Kasischke, S.D. Prince, <strong>and</strong> K.W. Pittman. 2008. Assessment of C-b<strong>and</strong> synthetic aperture radar<br />
for <strong>mapping</strong> <strong>and</strong> monitoring Coastal Plain forested <strong>wetl<strong>and</strong></strong>s in the Mid-Atlantic Region, U.S.A., Remote<br />
Sensing of Environment, 112:4120-4130.<br />
Lovel<strong>and</strong>, T.R., Merchant, J.W., Ohlen, D.O. <strong>and</strong> Brown, J.F., 1991. Development of a l<strong>and</strong>-cover characteristics<br />
database for the conterminous U.S. Photogrammetric Engineering <strong>and</strong> Remote Sensing, 57(11):1453-1463.<br />
Lunetta, R.S. <strong>and</strong> C.D. Elvidge. 1998. Eds., Remote Sensing Change Detection: Environmental Monitoring Methods<br />
<strong>and</strong> Applications, Taylor <strong>and</strong> Francis, London, 318 p.<br />
Tso, B. <strong>and</strong> P.M. Mather, 2001. Classification Methods for Remotely Sensed Data, Taylor <strong>and</strong> Francis, London, 332<br />
pp.<br />
Pecora 18 –Forty Years of Earth Observation…Underst<strong>and</strong>ing a Changing World<br />
November 14 – 17, 2011 ■ Herndon, Virginia