REPLACEMENT SENSOR MODEL (RSM) PERFORMANCE ... - asprs
REPLACEMENT SENSOR MODEL (RSM) PERFORMANCE ... - asprs
REPLACEMENT SENSOR MODEL (RSM) PERFORMANCE ... - asprs

Create successful ePaper yourself
Turn your PDF publications into a flip-book with our unique Google optimized e-Paper software.
<strong>REPLACEMENT</strong> <strong>SENSOR</strong> <strong>MODEL</strong> (<strong>RSM</strong>) <strong>PERFORMANCE</strong> FOR TRIANGULATION<br />
AND GEOPOSITIONING<br />
ABSTRACT<br />
Charles R. Taylor, Sr. Principal Engineer<br />
John T. Dolloff, Technical Director<br />
Michelle M. Iiyama, Sr. Principal Engineer<br />
BAE Systems<br />
10920 Technology Pl.<br />
MZ62ENG<br />
San Diego, CA, 92127<br />
charles.taylor@baesystems.com<br />
john.dolloff@baesystems.com<br />
michelle.iiyama@baesystems.com<br />
The Replacement Sensor Model (<strong>RSM</strong>) allows the functionality of many diverse sensor models to be captured in a<br />
single generic model. The <strong>RSM</strong> concept is for the replacement support data to be generated from the original sensor<br />
models and their image support data “up-stream” of the user community. Geopositioning performance studies of<br />
<strong>RSM</strong> compare the absolute and relative geolocations and error estimates (accuracy predictions) for objects or<br />
“targets” extracted from images using original sensor models with those extracted using <strong>RSM</strong> with the same image<br />
measurements. Triangulation performance studies of <strong>RSM</strong> compare the absolute and relative geolocations and error<br />
estimates of tie points that participate in triangulations. In these studies, two triangulations are performed – one<br />
based on the original sensor models and their image support data, and another based on the <strong>RSM</strong> sensor models and<br />
their image support data. The most recent <strong>RSM</strong> triangulation and geopositioning performance results are presented<br />
in this paper, incorporating the latest enhancements in <strong>RSM</strong> adjustability and error modeling. The results show that<br />
the <strong>RSM</strong> performance is virtually equivalent to the original sensor model performance.<br />
INTRODUCTION<br />
A complete geopositioning sensor model includes (as a minimum) the projective model algorithms to compute<br />
the image coordinates for any ground location in the field of view, an error model that describes the predicted<br />
accuracy of the projective model, and an adjustment model consistent with the error model to allow the projective<br />
model and error model to be improved by triangulation with other images and ground control. One of us (JTD)<br />
began to develop the Replacement Sensor Model as a generic mathematical model that has all of these capabilities<br />
and is capable of reproducing these functions with high fidelity for virtually any rigorous or physical sensor model.<br />
The theoretical development culminated in a Manual of Photogrammetry article (Dolloff, 2004) which outlines both<br />
the generic mathematical model and the algorithms for fitting them to existing sensor models.<br />
A Replacement Sensor Model Support Data (<strong>RSM</strong>SD) format was developed (Dolloff and Taylor, 2004) and<br />
then extended (Dolloff and Taylor, 2006). The first software development kit (<strong>RSM</strong> 1.0) implementing Dolloff's<br />
algorithms to generate and exploit <strong>RSM</strong>SD was released in 2004. A companion paper to this one (Dolloff et. al.<br />
2008) gives an extended overview of <strong>RSM</strong> including the integration status of the software.<br />
Performance studies of <strong>RSM</strong> have been conducted since its inception with favorable results, beginning with<br />
simulations and continuing with studies of various real sensors. One <strong>RSM</strong> performance study of note used large<br />
angular field-of-view aerial frame images (Taylor et. al., 2006). In this study it was found that the <strong>RSM</strong> projective<br />
model and error model performed virtually the same as a rigorous model for geopositioning and triangulation with<br />
the images under study. Projective model fitting errors were under 0.001 pixel, and error estimates and triangulation<br />
adjustments agreed with the rigorous frame sensor model to within 0.1 m in ground space.<br />
This paper gives new <strong>RSM</strong> performance study results from the latest software release (<strong>RSM</strong> 2.2). <strong>RSM</strong><br />
performance with commercial satellite imagery is addressed. After a brief description of the <strong>RSM</strong> support data<br />
generation process, we will describe the results of the projective model generation, adjustable parameter selection,<br />
and error covariance mapping for the QuickBird and WorldView images under study. We will then describe <strong>RSM</strong><br />
geopositioning and triangulation performance studies using QuickBird and WorldView.<br />
ASPRS 2008 Annual Conference<br />
Portland, Oregon April 28 - May 2, 2008
<strong>RSM</strong> SUPPORT DATA GENERATION<br />
<strong>RSM</strong> Generator Introduction<br />
As described in the companion paper, the <strong>RSM</strong> Generator module is a software development kit that can be<br />
integrated into any application. The application provides the original, rigorous sensor model to the <strong>RSM</strong> Generator<br />
through a standard Application Program Interface (API) and the <strong>RSM</strong> Generator uses it to create the <strong>RSM</strong>SD. In<br />
these studies, <strong>RSM</strong> Generator 2.2 was integrated into BAE Systems rapid prototyping environment, in which many<br />
commercial sensor models are available via BAE Systems Socet Set® software libraries. * No modifications to the<br />
<strong>RSM</strong> 2.2 code were needed to accomplish these new studies.<br />
The rapid prototyping environment used in the <strong>RSM</strong> performance studies also contains BAE Systems Multi-<br />
Image Geopositioning (MIG) service, which performs monoscopic, stereoscopic, and multi-image target extraction<br />
and triangulation with sensor models and Digital Elevation Models (DEMs). In order for the MIG service to use the<br />
<strong>RSM</strong>SD, <strong>RSM</strong> Exploiter 2.2 is also integrated into the environment. The <strong>RSM</strong> Exploiter parses the <strong>RSM</strong>SD and<br />
delivers sensor model functionality through the same API that is used for the original, rigorous sensor model. Thus,<br />
in addition to testing the <strong>RSM</strong> performance, the studies also demonstrate the capability of the <strong>RSM</strong>SD format to<br />
communicate all of the information needed to exploit <strong>RSM</strong>.<br />
The <strong>RSM</strong> Generator begins its processing by obtaining the original sensor type from the sensor model and<br />
looking up any fitting strategies that have been configured for that type. If there are none, then it uses the<br />
configured default strategies. Each strategy has an associated priority order, and if the first strategy results in a fit<br />
that doesn't meet the criteria, then the next strategy is tried. Typically one of the first strategies selected meets the fit<br />
criteria, but if necessary the <strong>RSM</strong> Generator will try all of the sensor-specific strategies followed by all of the<br />
default strategies until it finds a fit that meets the criteria. If all of the strategies are exhausted, then the <strong>RSM</strong><br />
Generator will return the best fit and alert the calling application that the criteria were not met.<br />
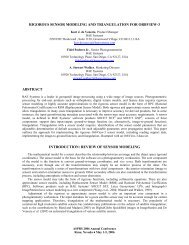
The strategy-driven logic of the <strong>RSM</strong> Generator is diagrammed in Figure 1. The same logic is used in both<br />
major operations of the <strong>RSM</strong> Generator: projective model fitting, and adjustable parameter selection/error<br />
covariance mapping.<br />
Start<br />
Save<br />
No<br />
No<br />
Usable?<br />
Yes<br />
Best<br />
so far?<br />
Yes<br />
No<br />
Get next<br />
strategy?<br />
Fit using strategy<br />
Compute metrics<br />
Pass?<br />
Yes<br />
Return<br />
this fit<br />
Yes<br />
Figure 1. <strong>RSM</strong> Generator logic.<br />
No more<br />
ASPRS 2008 Annual Conference<br />
Portland, Oregon ♦ April 28 - May 2, 2008<br />
Return best<br />
saved fit<br />
(if any)<br />
The sensor-specific and default strategies are configurable in each <strong>RSM</strong> Generator installation. On initial<br />
installation, the sensor-specific strategies are those that have been identified by BAE Systems in previous<br />
performance studies as having the best performance. In addition, the default strategies have been researched<br />
carefully, such that on initial installation the default strategies alone give good performance for every sensor that has<br />
been studied by BAE Systems. This gives the integrator confidence that the <strong>RSM</strong> Generator is likely to perform<br />
well even for a new sensor type that has not participated in previous performance studies.<br />
* Socet Set is a registered trademark of BAE Systems.
For the commercial satellite study being reported in the paper, the first tests were conducted without any sensorspecific<br />
strategies for QuickBird or WorldView. Following the procedures outlined in the <strong>RSM</strong> Generator Users<br />
Manual, the <strong>RSM</strong> generation metrics were reviewed for the first few images, and sensor-specific strategies that are<br />
minor departures from the defaults were created in order to arrive immediately at the best strategy. This<br />
configuration process required only a short time, and did not require any software modifications. Once complete,<br />
the configuration was used successfully for all of the images.<br />
Projective Model Fitting<br />
The primary elements of a projective model fitting strategy are whether to use rational polynomials for the<br />
ground-to-image function, and if so then how many sections will be used to cover the image, and which terms<br />
(coefficients) will be used in the numerator and denominator for the row and column functions, and whether to use<br />
an interpolating grid, either by itself or as a correction to the rational polynomials. Along with those primary<br />
elements, the strategy also specifies what ground coordinate system is to be used for the polynomials and/or grid,<br />
and how the fitting is to be done.<br />
The projective model fitting accuracy is evaluated by the <strong>RSM</strong> Generator as part of the fitting process. Since<br />
the fitting process typically uses the original sensor model ground-to-image function output on a regular 3dimensional<br />
grid, the evaluation is usually done by calling the original sensor model ground-to-image function at an<br />
additional 1000 points generated randomly in the image domain and height range of interest. It is these randomly<br />
selected evaluation points whose statistics will be considered below.<br />
A test set of 58 QuickBird 2 images and 4 WorldView 1 images were used to test the <strong>RSM</strong> Generator. The<br />
images were made available as Basic Products with rigorous sensor model support data. BAE Systems Socet Set<br />
was used to import the support data into the testbed, and Socet Set libraries provided the rigorous sensor model<br />
functionality in the testbed.<br />
Past testing with line-scanning sensors indicated that a polynomial with a correction grid would be a good<br />
choice for the <strong>RSM</strong> projective model for these sensors, and a few quick experiments confirmed this and provided a<br />
specific strategy. The coordinate system used is a rectangular system with the Z-axis along a nominal line of sight<br />
and the X-axis nominally aligned with the scan direction. The baseline polynomial is the same for both image row<br />
and image column. It has a numerator with terms up to fifth order in X and Y, and up to third order in Z, with cross<br />
terms up to a maximum combined order of 5. It has a denominator with terms of first order only (no cross terms).<br />
The same strategy is used for both QuickBird and WorldView with one exception. It was found that in order to<br />
keep the maximum <strong>RSM</strong> fitting error below 0.05 pixel required a finer grid-spacing in the X-direction for<br />
WorldView.<br />
The projective model fitting is summarized in Table 1. The "typical RMS fit error" is the mean of the RMS<br />
combined fit errors for all images. The "maximum fit error" is the largest combined (row and column) residual error<br />
for any point in any image. The "maximum grid spacing" is a strategy parameter such that the actual grid spacing is<br />
smaller in every image. The "typical grid spacing" is the mean for all of the images. The support data size per<br />
image is displayed as a range from the smallest to the largest.<br />
Table 1. Projective model statistics for QuickBird and WorldView<br />
<strong>RSM</strong> projective model fitting statistic QuickBird WorldView<br />
Number of images 58 4<br />
Number of image rows 25956 - 37120 57344 - 79872<br />
Number of image columns 27552 35840<br />
Typical RMS fit error 0.002 pixel 0.001 pixel<br />
Maximum fit error 0.040 pixel 0.049 pixel<br />
Maximum/Typical grid spacing-row direction 400 m / 250 m 100 m / 60 m<br />
Maximum/Typical grid spacing--column 2000 m / 1300 m 2000 m / 1100 m<br />
direction<br />
Grid spacing--LOS direction 1000 m 1000 m<br />
Original support data size 0.41 - 1.22 Mbyte 0.51 - 0.57 Mbyte<br />
<strong>RSM</strong> support data size 0.06 - 0.12 Mbyte 0.87 - 1.11 Mbyte<br />
The average time required to generate the <strong>RSM</strong> support data in these experiments was about 1.7 s per image for<br />
QuickBird and 12 s per image for WorldView, and the time also includes adjustable parameter selection and error<br />
ASPRS 2008 Annual Conference<br />
Portland, Oregon ♦ April 28 - May 2, 2008
covariance mapping (see the following section). These times are for a single Pentium processor running at 1.86<br />
GHz. No effort has been made to optimize the time performance of the <strong>RSM</strong> Generator, which tends to be limited<br />
by the time for the original sensor model projective model calls for the fitting and evaluation points. In addition to<br />
the ground-to-image calls needed to populate the interpolating grid, the 110 coefficients of the baseline polynomial<br />
(55 for row and 55 for column) are calculated by calling the original sensor model image-to-ground function at 1000<br />
fitting points, and the original sensor model image-to-ground function is also called at the 1000 randomly generated<br />
evaluation points.<br />
The polynomial for the baseline projective model is in a single section covering the entire image. The <strong>RSM</strong><br />
Generator automatically divides the interpolating grid into sections as needed in order to be represented within the<br />
<strong>RSM</strong>SD format. For QuickBird a single section was used, and for WorldView about 32 sections were used for each<br />
image.<br />
It is a simple matter to configure the <strong>RSM</strong> Generator for alternative projective model strategies, make the fits,<br />
and generate the metrics for comparison. A few of these are shown in Table 2 below. The cubic rational<br />
polynomial is the most commonly used replacement sensor model. The table shows that its typical RMS error is<br />
about one pixel, and the maximum error is nearly three pixels. The baseline rational polynomial when used without<br />
the interpolating grid does only slightly better. The last two lines of the table make use of the <strong>RSM</strong> capability of<br />
sectioning the image for the purposes of fitting the projective model. In each case, the images were sectioned into<br />
32 sections in the row direction and 8 sections in the column direction, for a total of 256 sections. The sectioned<br />
polynomials give fits that are much better than a single section for these images, but not nearly as good as the singlesection<br />
polynomial with the interpolating grid. Note also that the 256-section polynomial fits take about three times<br />
longer than the baseline projective model to generate.<br />
Table 2. Alternative projective models and metrics for WorldView<br />
<strong>RSM</strong> adjustable parameter set Typical RMS fit error Maximum fit error<br />
Baseline (rational polynomial with<br />
interpolation grid)<br />
0.001 pixel 0.049 pixel<br />
1-section cubic rational polynomial 0.915 2.617<br />
1-section baseline polynomial 0.880 2.564<br />
256-section cubic rational polynomial 0.076 0.317<br />
256-section baseline polynomial 0.059 0.286<br />
In summary, the <strong>RSM</strong> projective model fit is excellent for all of the images studied. The traditional<br />
replacement model, the cubic rational polynomial, is not able to attain subpixel projective model accuracy for these<br />
line scanning sensors, but <strong>RSM</strong> does so through the use of the interpolation grid, while keeping the support data size<br />
and time-to-fit within acceptable limits.<br />
Adjustable Parameter Selection and Error Covariance Mapping<br />
Adjustable parameter selection and error covariance mapping are done if the original sensor model has<br />
adjustable parameters with an associated error covariance that is available through the sensor model API. If the<br />
original sensor model does not have adjustable parameters with an associated error covariance, then these are not<br />
supported in the <strong>RSM</strong> Generator and Exploiter for that sensor, and only the projective model is supported. The<br />
<strong>RSM</strong> adjustable parameters and their associated error covariance are distinct from the parameters of the <strong>RSM</strong><br />
projective model. The adjustable parameters are chosen and the original sensor model error covariance is mapped to<br />
these parameters such that the <strong>RSM</strong> performance is a good match to the original sensor model performance for<br />
adjustment and error propagation.<br />
As with the projective model fitting, the <strong>RSM</strong> Generator begins the adjustable parameter selection process by<br />
obtaining the original sensor type from the sensor model and looking up any strategies that have been configured for<br />
that type. If there are none, then it uses the configured default strategies.<br />
The primary choice to be made in choosing the <strong>RSM</strong> adjustable parameters is whether the adjustments should<br />
be applied prior to the <strong>RSM</strong> ground-to-image projection ("ground-space adjustment") or after ("image-space<br />
adjustment"). Past experiments have shown that ground-space adjustment is best for frame sensors and image-space<br />
adjustment is best for line scanning sensors. (For other sensors such as SAR there is little difference between<br />
ground-space and image-space adjustment choices.)<br />
ASPRS 2008 Annual Conference<br />
Portland, Oregon ♦ April 28 - May 2, 2008
Another choice to be made is which specific ground- or image-space adjustment parameters are to be<br />
considered, and whether the best linear combinations of the parameters are to be used or whether the parameters are<br />
to be used without being combined. The former is recommended by the <strong>RSM</strong> development team, and it requires the<br />
updated <strong>RSM</strong>SD format.<br />
When the choice is made to use the best linear combinations of the <strong>RSM</strong> adjustable parameters, the <strong>RSM</strong><br />
Generator performs a principal components analysis of the <strong>RSM</strong> adjustable parameter error covariance, and selects<br />
enough of the resulting eigenvectors to match the original sensor model performance faithfully. The error<br />
covariance condition number is also computed and used as a criterion in the selection process. (The condition<br />
number computation insures that the <strong>RSM</strong> adjustable error covariance is a legitimate positive-definite matrix and<br />
gives confidence that the adjustment and error propagations that use it will be numerically stable.) Since the <strong>RSM</strong><br />
adjustable parameter error covariance is diagonal when expressed in terms of the principal components, it results in<br />
very stable performance in adjustment.<br />
Note that the "choices" above are made when the <strong>RSM</strong> Generator is configured. In normal operation, the<br />
adjustable parameter selection and covariance mapping (and indeed all of the steps of the <strong>RSM</strong>SD generation) are<br />
done automatically by the <strong>RSM</strong> Generator, with no operator interaction required.<br />
The error covariance mapping is done as described in the Manual of Photogrammetry article referenced in the<br />
introduction. This process requires the original sensor model, from which the <strong>RSM</strong> Generator obtains the adjustable<br />
parameters and their error covariance. The a priori QuickBird adjustable parameter error covariance used was the<br />
default covariance coded in Socet Set. Since the Socet Set WorldView sensor model was coded prior to the<br />
calibration of the WorldView sensor, the coded defaults were not used. An a priori error covariance consistent with<br />
the WorldView specification was used instead.<br />
A few quick experiments with QuickBird and WorldView confirmed our earlier findings that image-space<br />
adjustable parameters perform well for line-scanning sensors. The image-space adjustable parameters are two<br />
correction polynomials, one for image row (line) and one for image column (sample), that are applied after the<br />
projective model computations in the ground-to-image function as explained in the companion paper. We chose to<br />
allow linear combinations of image space corrections as a function of the image-aligned rectangular coordinates,<br />
with terms up to third order in X and Y and up to first order in Z, with cross-terms up to a maximum combined order<br />
of 3. This is a total of 32 terms, from which the <strong>RSM</strong> Generator chooses the best linear combinations. Since the<br />
number of original sensor model adjustable parameters is 6, the number of combinations must also be 6 or less, and<br />
6 were used.<br />
The adjustable parameter selection and covariance mapping metrics are summarized in Table 3. The<br />
normalized frobenius norm of the residual adjustable parameter error covariance projected to image space is a<br />
covariance mapping metric that can be regarded as a fractional error in the process. The maximum for either image<br />
type is much less than 0.01, and the smaller the normalized frobenius norm the better the covariance mapping. The<br />
condition numbers of the error covariances are shown as well. The smaller the condition number the more stable the<br />
error covariance is likely to be in adjustment and error propagation computations.<br />
Table 3. Adjustable parameter selection and error covariance mapping statistics for QuickBird and WorldView<br />
<strong>RSM</strong> projective model fitting statistic QuickBird WorldView<br />
Typical normalized frobenius norm 0.0016 0.000783<br />
Maximum normalized frobenius norm 0.0039 0.000836<br />
Typical condition number 3.5e+4 4.0e+6<br />
Maximum condition number 1.11e+6 1.14e+7<br />
It is instructive to compare the metrics of the adjustable parameter selection and error covariance mapping<br />
process with those of other potential <strong>RSM</strong> adjustable parameter sets. This comparison can be seen in Table 4 for the<br />
WorldView test images and three variations on the adjustable parameter set. With six ground-space adjustable<br />
parameters, a set that typically works well for frame images, the normalized frobenius norm is about three times<br />
larger than for the baseline set, which is still good, but the condition number is up to two orders of magnitude larger,<br />
so that solutions are not as stable. The 6-parameter image-space adjustment that is linear in image coordinates is a<br />
set sometimes used with RPC replacement models, despite the fact that the NITF TREs aren't capable of<br />
transmitting the error covariance. Its normalized frobenius norm is about four times larger than for the baseline set<br />
and the condition number is up to an order of magnitude larger. The 2-parameter image space offsets have a much<br />
lower fidelity with a normalized frobenius norm over ten times larger than for the baseline set. The condition<br />
number is of course much smaller than for the baseline case since there are only two parameters.<br />
ASPRS 2008 Annual Conference<br />
Portland, Oregon ♦ April 28 - May 2, 2008
Table 4. Alternative adjustable parameter selection and error covariance mapping statistics for WorldView<br />
<strong>RSM</strong> adjustable parameter set Maximum normalized Maximum<br />
frobenius norm condition number<br />
Baseline (6 linear combinations of imagespace<br />
adjustments as a function of imagealigned<br />
ground coordinates)<br />
0.000826 1.14e+7<br />
6-parameter ground-space offset and rotation 0.002570 1.52e+9<br />
6-parameter image-space adjustment linear in<br />
image coordinates<br />
0.003024 3.46e+8<br />
2-parameter image-space offsets 0.010016 1.01<br />
The adjustable parameter selection and covariance mapping results show that the <strong>RSM</strong> Generator has arrived at<br />
a superior adjustable parameter set for these test images, and it has done so automatically given the original sensor<br />
models and the <strong>RSM</strong> Generator configuration.<br />
<strong>RSM</strong> GEOPOSITIONING <strong>PERFORMANCE</strong> STUDIES WITH QUICKBIRD<br />
The geopositioning performance studies conducted with QuickBird test images were of the type outlined in<br />
Figure 2, termed the "replace/extract" scenario.<br />
Original<br />
support<br />
data<br />
Extract<br />
Generate <strong>RSM</strong><br />
Extract<br />
ASPRS 2008 Annual Conference<br />
Portland, Oregon ♦ April 28 - May 2, 2008<br />
Compare:<br />
absolute and<br />
relative point<br />
positions,<br />
absolute and<br />
relative error<br />
estimates<br />
Figure 2. "Replace/Extract" <strong>RSM</strong> geopositioning performance test procedure.<br />
The rigorous "original" sensor model is provided to the testbed by the Socet Set libraries. Prior to testing, the<br />
images have been imported with Socet Set, so the "original support data" consists of Socet Set support files.<br />
The "extract" operation is done with BAE Systems Multiple-Image Geopositioning (MIG) service. It consists<br />
of a simultaneous least squares solution for the point positions given their measurements in all images. In the case<br />
of extraction from a single image, Digital Terrain Elevation Database (DTED) is used to establish the point heights.<br />
The sources of error in MIG error propagation are image measurement errors (estimated at 2 pixels 1-sigma), sensor<br />
model adjustable parameter errors, and DTED errors.<br />
The <strong>RSM</strong> support data generation is done with the <strong>RSM</strong> Generator, and the sensor model used in the <strong>RSM</strong><br />
extraction is provided by the <strong>RSM</strong> support data and the <strong>RSM</strong> Exploiter. The <strong>RSM</strong> extraction is done with the same<br />
MIG service used for the original sensor model extraction. The same image measurements and uncertainty are used<br />
as for the original sensor model extraction. The sensor model adjustable parameters for the <strong>RSM</strong> extraction are the<br />
ones selected by the <strong>RSM</strong> Generator and communicated via the <strong>RSM</strong> support data.<br />
The first test set for <strong>RSM</strong> geopositioning tests with QuickBird consists of a pair of overlapping images acquired<br />
on different passes. The first image has an off-nadir angle of 8 degrees and the second has an off-nadir angle of 29<br />
degrees. The stereo convergence angle is 24 degrees. The ground sample distances (GSDs) are 0.6 m to 0.7 m<br />
(measured normal to the nominal line of sight). The horizontal CE for the QuickBird images is 23 m at nadir, and<br />
somewhat larger off-nadir. (The confidence level for all absolute and relative CE and LE metrics in this paper is 90<br />
% and is computed from the appropriate a posteriori ground point error covariance matrix.) Two corresponding<br />
points were measured in each of these two images, and geopositioning was performed for each image with DTED,
and for the stereo pair. The original sensor model results and the <strong>RSM</strong> results are tabulated in Table 5 (absolute<br />
geopositioning) and Table 6 (relative geopositioning).<br />
The first two columns of Table 5 identify the images and point used for the row. The third and fourth columns<br />
are the horizontal CE for geopositioning with the original sensor model and with <strong>RSM</strong>. In every case these are in<br />
extremely good agreement. Note that for single-image geopositioning the CE is larger for the second point than the<br />
first, because the off-nadir angle is greater, and therefore the DTED vertical error affects it to a greater degree.<br />
The fifth and sixth columns of Table 5 are the vertical LE using the original sensor model and <strong>RSM</strong>. For<br />
single-image geopositioning, the LE is strictly determined by the DTED accuracy, so it is not surprising that the<br />
original sensor model and <strong>RSM</strong> are in good agreement, but the agreement is excellent for stereo geopositioning as<br />
well. (The LE is larger for stereo geopositioning than for mono, because the convergence angle is not very<br />
favorable, and the DTED was not used to assist the stereo geopositioning for these tests.)<br />
The seventh column of Table 5 is the difference in the horizontal position for <strong>RSM</strong> geopositioning as compared<br />
to the original sensor model geopositioning. The largest difference in the table is 0.074 m, which is an insignificant<br />
fraction of the horizontal uncertainty of 26.239 m for the same point. The last column of Table 5 is the difference in<br />
the vertical position for the <strong>RSM</strong> geopositioning as compared to the original sensor model geopositioning. Only the<br />
last two rows are significant (because DTED is the only source of vertical information for the single-image cases),<br />
and these are in extremely good agreement.<br />
Table 5. Absolute geopositioning results for 2 QuickBird images<br />
Image(s) Point Original <strong>RSM</strong> Original <strong>RSM</strong> Horiz. Pos. Vert. Pos.<br />
CE (m) CE (m) LE (m) LE (m) diff. (m) diff. (m)<br />
1 1 24.550 24.556 18.001 18.001 0.001 0.000<br />
1 2 25.055 25.062 18.000 18.000 0.000 0.000<br />
2 1 31.361 31.309 18.001 18.001 0.004 0.000<br />
2 2 31.942 31.884 18.002 18.002 0.006 0.000<br />
1 and 2 1 26.239 26.233 63.901 63.779 0.074 -0.028<br />
1 and 2 2 26.562 26.558 65.256 65.136 0.067 -0.084<br />
It is not enough to assess the <strong>RSM</strong> performance with absolute geopositioning results. Sensor models are also<br />
used to compute point-to-point distances, angles, and so forth, which requires high-fidelity relative geopositioning.<br />
The relative geopositioning results in Table 6 below show that <strong>RSM</strong> has excellent performance for these purposes<br />
just as it has for absolute geopositioning. The first two columns identify the images and points used for the row.<br />
The third and fourth columns are the relative CE for the point pair, computed with the original sensor model and<br />
<strong>RSM</strong>. Note that CErel is larger for the second image, because the off-nadir angle is greater and the random DTED<br />
error has a greater horizontal effect.<br />
The fifth and sixth columns of Table 6 are the relative LE for original sensor model and <strong>RSM</strong> geopositioning,<br />
respectively. The results are identical for single-image geopositioning, due to the use of the same DEM, and the<br />
result is in excellent agreement for stereo geopositioning.<br />
The seventh column of Table 6 is the relative horizontal position difference, that is, the difference in the<br />
horizontal distance from the two geopositioning solutions. The small differences are negligible in comparison with<br />
the horizontal error estimates.<br />
The last column of Table 6 is the relative vertical position difference, that is, the difference in the height of the<br />
second point relative to the first as computed using <strong>RSM</strong> as compared with the original sensor model. Only the last<br />
entry is significant due to use of the same DEM for single-image geopositioning, and the difference of 0.056 m is<br />
tiny in comparison with the relative LE of 10.096 m.<br />
Table 6. Relative geopositioning results for 2 QuickBird images<br />
Image(s) Points Original <strong>RSM</strong> Original <strong>RSM</strong> Rel. Horiz. Rel. Vert.<br />
CErel (m) CErel (m) LErel (m) LErel (m) Pos. diff. (m) Pos. diff. (m)<br />
1 1-2 5.504 5.505 25.457 25.457 0.001 0.000<br />
2 1-2 15.447 15.448 25.458 25.458 0.002 0.000<br />
Stereo 1-2 4.112 4.113 10.096 10.097 0.008 0.056<br />
ASPRS 2008 Annual Conference<br />
Portland, Oregon ♦ April 28 - May 2, 2008
A more challenging extraction test case was established as follows. In one of the QuickBird image sets there<br />
are 56 images in 7 strips of 8 images each. The overlap of two of the strips is at the reasonably favorable<br />
convergence angle of 30 degrees. Along the overlap many tie points have been measured. The extraction test below<br />
is a 10-point simultaneous extraction that uses 4 adjacent images on the strip. The results of this test are<br />
summarized in Table 7 and Table 8.<br />
Table 7. Absolute geopositioning statistics for simultaneous extraction of 10 points from four QuickBird images<br />
Statistic Original <strong>RSM</strong> Original <strong>RSM</strong> Horiz. Pos. Vert. Pos.<br />
CE (m) CE (m) LE (m) LE (m) diff. (m) diff. (m)<br />
RMS 24.711 24.715 53.956 53.962 0.037 0.118<br />
Max 35.695 35.696 76.020 75.965 0.065 0.269<br />
Table 8. Relative geopositioning statistics for simultaneous extraction of 10 points from four QuickBird images<br />
Statistic Original <strong>RSM</strong> Original <strong>RSM</strong> Horiz. Rel. Vert. Rel.<br />
CErel (m) CErel (m) LErel (m) LErel (m) Pos. diff. (m) Pos. diff. (m)<br />
RMS 31.002 31.001 67.648 67.639 0.053 0.166<br />
Max 50.384 50.365 108.224 108.126 0.115 0.380<br />
The results in Table 7 and Table 8 show that even in a more complex multi-image target extraction the <strong>RSM</strong><br />
performance is a very good approximation to that of the original sensor model. The error estimates (absolute and<br />
relative CE and LE) are virtually indistinguishable, with differences between the two less than 0.1 percent. In terms<br />
of the computed absolute point positions, the largest difference was 0.065 m in horizontal position for one of the<br />
points, which was much less than one percent of CE. Similarly, the largest difference in relative positions was 0.38<br />
m which was much less than one percent of the relative LE.<br />
The excellent agreement in QuickBird target extraction results for <strong>RSM</strong> as compared with the original rigorous<br />
sensor model are typical of what has been seen for other sensors in other studies. We next consider the WorldView<br />
sensor, and additional scenarios that showcase additional capabilities of <strong>RSM</strong>.<br />
GEOPOSITIONING <strong>PERFORMANCE</strong> STUDIES WITH WORLDVIEW<br />
The test procedure of Figure 2 is just the first of four tests of increasing complexity that were performed with<br />
two overlapping WorldView images. The second of these, termed the "triangulate/replace/extract" test is shown in<br />
Figure 3. The procedure is for the sensor models to be triangulated with ground control and tie points before being<br />
used for extraction and <strong>RSM</strong> generation. The adjusted sensor models and the full a posteriori joint error covariance<br />
(a 12x12 matrix) of the adjustable parameters for the two images are provided to both the MIG tool for the rigorous<br />
sensor model target extraction and the <strong>RSM</strong> Generator. The <strong>RSM</strong> support data contain the full joint error<br />
covariance of the <strong>RSM</strong> adjustable parameters, and this is used in the MIG for the <strong>RSM</strong> sensor model target<br />
extraction.<br />
Original<br />
support<br />
data<br />
Triangulate<br />
Extract<br />
Generate <strong>RSM</strong><br />
Extract<br />
ASPRS 2008 Annual Conference<br />
Portland, Oregon ♦ April 28 - May 2, 2008<br />
Compare:<br />
absolute and<br />
relative point<br />
positions,<br />
absolute and<br />
relative error<br />
estimates<br />
Figure 3. "Triangulate/Replace/Extract" <strong>RSM</strong> geopositioning performance test procedure.
In the two test procedures already described, the <strong>RSM</strong> adjustable parameters are not actually adjusted, they are<br />
just a vehicle for the error propagation. In the third and fourth scenarios they are adjusted. The "triangulate/replace"<br />
scenario is shown in Figure 4. The performance is measured for the tie points that participate in the triangulation:<br />
their geolocations and error estimates are expected to be nearly the same after triangulation if <strong>RSM</strong> is successful.<br />
Original<br />
support<br />
data<br />
Triangulate<br />
Generate <strong>RSM</strong><br />
Triangulate<br />
ASPRS 2008 Annual Conference<br />
Portland, Oregon ♦ April 28 - May 2, 2008<br />
Compare:<br />
absolute and<br />
relative tie<br />
point<br />
positions,<br />
absolute and<br />
relative error<br />
estimates<br />
Figure 4. "Replace/Triangulate" <strong>RSM</strong> geopositioning performance test procedure.<br />
The "replace/triangulate/extract" scenario of Figure 5 is the most challenging end-to-end <strong>RSM</strong> performance test.<br />
Not only must the <strong>RSM</strong> triangulation and subsequent extraction give results close to those of the original sensor<br />
model triangulation and subsequent extraction, but the <strong>RSM</strong>SD must be generated once prior to the triangulation and<br />
then updated prior to the extraction. Note that in the second call to the <strong>RSM</strong> Generator, it is the <strong>RSM</strong> sensor model<br />
that is input and not the original sensor model. The projective model fit and the adjustable parameter selection/error<br />
covariance mapping are not repeated, but rather the parameter adjustments and a posteriori error covariance are<br />
placed in the appropriate support data extensions and these are used to supplement the <strong>RSM</strong>SD already present.<br />
Original<br />
support<br />
data<br />
Triangulate<br />
Generate <strong>RSM</strong><br />
Triangulate<br />
Extract<br />
Generate<br />
adjusted<br />
<strong>RSM</strong> Extract<br />
Compare:<br />
absolute and<br />
relative point<br />
positions,<br />
absolute and<br />
relative error<br />
estimates<br />
Figure 5. "Replace/Triangulate/Extract" <strong>RSM</strong> geopositioning performance test procedure.<br />
The replace/triangulate/extract tests showcase an <strong>RSM</strong> capability that is not present with many original sensor<br />
models in use: a support data format that is able to capture parameter adjustments and the associated full error<br />
covariance. The ability to do this, for any sensor, should serve as motivation to integrate <strong>RSM</strong> into exploitation<br />
systems.<br />
The WorldView performance test results for absolute geopositioning are shown in Table 9 for all four scenarios.<br />
The relative geopositioning results are shown in Table 10. The first two columns of each table identify the scenario<br />
and the statistic under consideration. The third and fourth columns give the CE (or CErel) for the original sensor<br />
model and <strong>RSM</strong> test, respectively. The fifth and sixth columns give the LE (or LErel) for the original sensor model<br />
and <strong>RSM</strong>. The last two columns give the absolute (or relative) horizontal and vertical position differences.<br />
For all except the replace/triangulate scenario, the statistics are over the four points used for target extraction.<br />
For the replace/triangulate scenario, the statistics are over the nine tie points used in the triangulation. The image<br />
measurement errors are estimated at one pixel (one-sigma) for all of the points.
The same four ground control and nine tie points are used in the triangulation in the three scenarios that include<br />
triangulation.<br />
The off-nadir look angles for the images are about 37 degrees and 25 degrees. The stereo convergence angle for<br />
the two images is about 31 degrees. The GSDs are 0.55m to 0.62 m (measured normal to the line of sight). The<br />
replace/extract absolute CE statistics are around 5.1 m, within the specification of 6.5 m and the range of 4.0-5.5 m<br />
stated as a typical horizontal accuracy for WorldView images (at nadir, apart from terrain effects). The other<br />
scenarios, which include triangulation with control, have CE within the 2 m stated for WorldView images with<br />
control. Note that the ground control point accuracy has been estimated at one-meter (one-standard-deviation along<br />
all three axes), which is easily obtainable with GPS surveying. Prior to triangulation the errors between the ground<br />
control points are assumed to be uncorrelated.<br />
For all of the scenarios, the <strong>RSM</strong> performance is excellent in all respects, for both absolute and relative<br />
geopositioning. For absolute geopositioning, the statistics are over the four extracted points (9 tie points for the<br />
replace/triangulate scenario). For relative geopositioning, the statistics are over the six possible pairs of extracted<br />
points (36 tie point pairs for the replace/triangulate scenario). The largest differences in error estimates (absolute or<br />
relative CE or LE) for any of the tests is under 0.01 m. The largest solution differences (absolute or relative<br />
horizontal or vertical position) are about 0.04 m for the replace/triangulate scenario, where these differences are an<br />
insignificant 2 % or less of the corresponding error estimate.<br />
Table 9. Absolute geopositioning results for 2 WorldView images<br />
Scenario Statistic Original <strong>RSM</strong> Original <strong>RSM</strong> Horiz. Pos. Vert. Pos.<br />
CE (m) CE (m) LE (m) LE (m) diff. (m) diff. (m)<br />
Replace/Extract RMS 5.076 5.077 8.287 8.287 0.014 0.030<br />
Max 5.136 5.136 8.307 8.313 0.014 0.030<br />
Triangulate/ RMS 1.845 1.845 2.668 2.668 0.002 0.001<br />
Replace/Extract Max 1.860 1.860 2.677 2.678 0.002 0.002<br />
Replace/<br />
RMS 1.846 1.846 2.687 2.686 0.011 0.016<br />
Triangulate Max 1.889 1.888 2.733 2.731 0.024 0.038<br />
Replace/<br />
RMS 1.845 1.845 2.668 2.668 0.004 0.005<br />
Triangulate/Extract Max 1.860 1.860 2.677 2.677 0.005 0.007<br />
Table 10. Relative geopositioning results for 2 WorldView images<br />
Scenario Statistic Original<br />
CErel (m)<br />
<strong>RSM</strong><br />
CErel (m)<br />
Original<br />
LErel (m)<br />
<strong>RSM</strong><br />
LErel (m)<br />
ASPRS 2008 Annual Conference<br />
Portland, Oregon ♦ April 28 - May 2, 2008<br />
Horiz. Rel.<br />
Pos. diff. (m)<br />
Vert. Rel.<br />
Pos. diff.<br />
(m)<br />
Replace/Extract RMS 1.981 1.981 3.227 3.227 0.001 0.000<br />
Max 1.991 1.991 3.240 3.240 0.001 0.001<br />
Triangulate/ RMS 1.979 1.979 3.227 3.227 0.001 0.000<br />
Replace/Extract Max 1.991 1.991 3.240 3.239 0.001 0.001<br />
Replace/<br />
RMS 1.982 1.982 3.252 3.252 0.013 0.019<br />
Triangulate Max 2.025 2.025 3.299 3.299 0.027 0.043<br />
Replace/<br />
RMS 1.979 1.979 3.227 3.227 0.003 0.004<br />
Triangulate/Extract Max 1.991 1.991 3.240 3.239 0.004 0.005<br />
Excellent <strong>RSM</strong> performance for triangulation and geopositioning has been seen in all of the WorldView<br />
scenarios in this section. These studies have been done with one stereo pair. Photogrammetric triangulations often<br />
involve many images, but all of the complexity of the problem is already present with two images, multiple tie<br />
points, and multiple ground control points, and these are very large images.<br />
CONCLUSION<br />
The tests conducted for this study show excellent agreement in triangulation and geopositioning between <strong>RSM</strong><br />
and the rigorous commercial satellite sensor models they replace. Not only is the <strong>RSM</strong> projective model a very
good fit to the original, but the error estimates are very close, and the models perform virtually the same with<br />
triangulation adjustments.<br />
These results supplement earlier studies that demonstrated equally good performance for other types of<br />
imagery. In all of these studies, both the original and the <strong>RSM</strong> sensor models were used in the testbed to show the<br />
performance match. With each successful study, there is added confidence that a lean exploitation system with a<br />
single sensor model, <strong>RSM</strong> alone, is viable.<br />
The viability of the <strong>RSM</strong>SD format has received additional confirmation, since the testbed used it in every test<br />
to transmit the support data from the <strong>RSM</strong> Generator to the <strong>RSM</strong> Exploiter. The maturity of the <strong>RSM</strong> software<br />
development kits (Generator and Exploiter) has also received confirmation, since no modifications were made in the<br />
course of the study.<br />
The way forward for <strong>RSM</strong> is clear: <strong>RSM</strong>SD should now be generated and included in image products along<br />
with rigorous sensor model support data, to enable performance testing by the wider community, and the<br />
development of leaner, more robust and less expensive <strong>RSM</strong>-only exploitation systems.<br />
ACKNOWLEDGEMENTS<br />
We would like to thank Walter Scott and Milan Karspak of Digital Globe, Ed Mikhail of Purdue University, and<br />
Fidel Paderes, Reuben Settergren, Kevin Allen, Karen Diener, Randy Burt, Brian Highland, and Shannon McDonald<br />
of BAE Systems for their contributions to the <strong>RSM</strong> performance studies.<br />
REFERENCES<br />
Dolloff, J.T., 2004. Replacement Sensor Models, Chapter 11.3, Manual of Photogrammetry, 5th Edition,<br />
J. C. McGlone, Editor, ASPRS, pp. 887-943.<br />
Dolloff, J.T. and C.R. Taylor, 2004. Replacement Sensor Model Tagged Record Extensions Specification for NITF<br />
2.1,<br />
http://www.gwg.nga.mil/ntb/coordinationitems/<strong>RSM</strong>%20TRE%20Appendix%20A_July_23_04.pdf.<br />
Dolloff, J.T. and C.R. Taylor, 2006. Proposed Updates to <strong>RSM</strong> TREs (Updates to the Replacement Sensor Model<br />
Tagged Record Extensions Specification for NITF 2.1,<br />
http://www.socetgxp.com/docs/products/special/pp_rsm_treupdates.pdf<br />
Dolloff, J.T., M.M. Iiyama, and C.R. Taylor, 2008. The Replacement Sensor Model (<strong>RSM</strong>): Overview, Status, and<br />
Performance Summary, ASPRS 2008 Annual Conference, April 28 - May 2, 2008 (forthcoming).<br />
Taylor, C.R., J.T. Dolloff, M.M. Iiyama, and E.M. Mikhail, 2006. <strong>RSM</strong> Extraction and Adjustment of Large Field<br />
of View Frame Imagery, http://www.socetgxp.com/docs/products/special/pp_rsm_largeformatframe.pdf.<br />
ASPRS 2008 Annual Conference<br />
Portland, Oregon ♦ April 28 - May 2, 2008