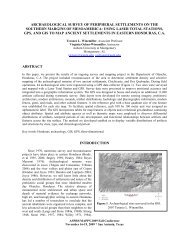
comparison of changes in groundwater storage using grace ... - asprs
comparison of changes in groundwater storage using grace ... - asprs
comparison of changes in groundwater storage using grace ... - asprs

Create successful ePaper yourself
Turn your PDF publications into a flip-book with our unique Google optimized e-Paper software.
COMPARISON OF CHANGES IN GROUNDWATER STORAGE USING GRACE<br />
DATA AND A HYDROLOGICAL MODEL IN CALIFORNIA’S CENTRAL VALLEY<br />
Amber Kuss, San Francisco State University<br />
William T. Brandt, California State University, Monterey Bay<br />
Joshua Randall, Arizona State University<br />
Bridget Floyd, University <strong>of</strong> California, Berkeley<br />
Abdelwahab Bourai, Cupert<strong>in</strong>o High School<br />
Michelle Newcomer, San Francisco State University<br />
C<strong>in</strong>dy Schmidt, Bay Area Environmental Research Institute<br />
J.W. Skiles Ph.D., NASA Ames Research Center<br />
DEVELOP NASA Ames Research Center<br />
M.S. 239-20 M<strong>of</strong>fett Field, California 94035<br />
Amberjean.m.kuss@nasa.gov<br />
Joseph.Skiles@nasa.gov<br />
ABSTRACT<br />
The Gravity Recovery and Climate Experiment (GRACE) measures gravity anomalies on earth to estimate <strong>changes</strong><br />
<strong>in</strong> total water <strong>storage</strong> (TWS), and may be a useful tool for calculat<strong>in</strong>g <strong>changes</strong> <strong>in</strong> <strong>groundwater</strong> <strong>storage</strong> for<br />
California’s agriculturally productive Central Valley region. Under current California law, well owners are not<br />
required to report <strong>groundwater</strong> extraction rates, mak<strong>in</strong>g estimation <strong>of</strong> total <strong>groundwater</strong> extraction difficult. As a<br />
result, other <strong>groundwater</strong> change detection techniques are used to estimate <strong>changes</strong> <strong>in</strong> <strong>groundwater</strong> <strong>storage</strong> <strong>in</strong> the<br />
Central Valley aquifer. From October 2002 to September 2009, GRACE was used to measure <strong>changes</strong> <strong>in</strong> TWS for<br />
the Sacramento River Bas<strong>in</strong>, and the San Joaqu<strong>in</strong> River Bas<strong>in</strong> (<strong>in</strong>clud<strong>in</strong>g the Tulare Lake Bas<strong>in</strong>), which conta<strong>in</strong> the<br />
Central Valley aquifer. Net <strong>groundwater</strong> <strong>storage</strong> <strong>changes</strong> were calculated from the <strong>changes</strong> <strong>in</strong> TWS by <strong>in</strong>corporat<strong>in</strong>g<br />
estimates for additional components <strong>of</strong> the hydrological budget <strong>in</strong>clud<strong>in</strong>g soil moisture, snow pack, and surface<br />
water <strong>storage</strong>. The <strong>changes</strong> <strong>in</strong> <strong>groundwater</strong> <strong>storage</strong> at the river bas<strong>in</strong> and regional level (the two bas<strong>in</strong>s comb<strong>in</strong>ed)<br />
were then compared to modeled values calculated us<strong>in</strong>g the California Department <strong>of</strong> Water Resources’ Central<br />
Valley Groundwater-Surface Water Simulation Model (C2VSIM). At the regional level (the Central Valley aquifer)<br />
it was found that GRACE-derived estimates <strong>of</strong> <strong>groundwater</strong> change <strong>in</strong> <strong>storage</strong> produced comparable results to<br />
C2VSIM. However, at the river bas<strong>in</strong> level (Sacramento and San Joaqu<strong>in</strong>), GRACE-derived estimates were<br />
significantly different from those modeled by C2VSIM, highlight<strong>in</strong>g the current limit <strong>of</strong> GRACE’s spatial<br />
resolution. This work has the potential to improve California’s <strong>groundwater</strong> resource management at the regional<br />
level and <strong>in</strong> validat<strong>in</strong>g exist<strong>in</strong>g hydrological models for the Central Valley. The work also underscores the need for<br />
higher resolution satellite data that are applicable smaller scale management.<br />
KEYWORDS: GRACE, <strong>groundwater</strong> <strong>storage</strong>, Central Valley, remote sens<strong>in</strong>g, hydrological budget, C2VSIM, GIS,<br />
soil moisture, and snowpack<br />
INTRODUCTION<br />
The Central Valley aquifer system (52,000 km 2 ), located <strong>in</strong> California, is one <strong>of</strong> the most productive<br />
agricultural regions <strong>in</strong> the world (Faunt et al., 2009). The Central Valley supplies nearly 7 percent <strong>of</strong> the United<br />
States (U.S.) food supply, with an estimated annual value <strong>of</strong> $21 billion dollars (California Department <strong>of</strong> Food and<br />
Agriculture, 2010). Additionally, the Central Valley aquifer is the second most heavily pumped <strong>in</strong> the U.S.,<br />
supply<strong>in</strong>g nearly 20% <strong>of</strong> the Nation’s <strong>groundwater</strong> demand (Kenny et al., 2009). California law does not regulate<br />
<strong>groundwater</strong> extraction at the state level; rather <strong>groundwater</strong> management is implemented at the local level and<br />
<strong>in</strong>cludes <strong>groundwater</strong> monitor<strong>in</strong>g, bas<strong>in</strong> and sub-bas<strong>in</strong> management, and restrictions <strong>in</strong> the development and use <strong>of</strong><br />
water (California Department <strong>of</strong> Water Resources, 2003). Also, variations <strong>in</strong> climate, such as the 2007–2009<br />
drought have also affected <strong>groundwater</strong> availability <strong>in</strong> California, with <strong>in</strong>creased demand on the Central Valley<br />
aquifer.<br />
ASPRS 2012 Annual Conference<br />
Sacramento, California ♦ March 19-23, 2012
The California Department <strong>of</strong> Water Resources (DWR) has developed an analytical tool, the Central Valley<br />
Groundwater-Surface Water Simulation Model (C2VSIM), to assess the <strong>groundwater</strong> resources and alternative<br />
<strong>groundwater</strong> management strategies <strong>in</strong> the Central Valley. C2VSIM is a f<strong>in</strong>ite element hydrologic model that can<br />
calculate change <strong>in</strong> <strong>groundwater</strong> <strong>storage</strong> on an element by element basis. The calculated change <strong>in</strong> <strong>groundwater</strong><br />
<strong>storage</strong> can be aggregated for each <strong>of</strong> the 21 subregions that def<strong>in</strong>e the Central Valley <strong>in</strong> the model. The change <strong>in</strong><br />
<strong>storage</strong> can also be aggregated for the three hydrologic regions (the Sacramento River Bas<strong>in</strong>, the San Joaqu<strong>in</strong> River<br />
Bas<strong>in</strong>, and the Tulare Lake Bas<strong>in</strong>) as well as the entire Central Valley. C2VSIM-simulated change <strong>in</strong> <strong>groundwater</strong><br />
<strong>storage</strong> is the residual value from a <strong>groundwater</strong> budget equation that <strong>in</strong>corporates variables such as precipitation,<br />
streamflow, reservoir <strong>storage</strong>, evapotranspiration (ET), soil moisture, surface water diversions, land use parameters,<br />
hydraulic conductivity, and aquifer properties (Brush et al., 2008).<br />
NASA’s Gravity Recovery and Climate Experiment (GRACE) satellite has improved the ability to estimate<br />
components <strong>of</strong> the hydrological budget for many large-scale bas<strong>in</strong>s throughout the world (Rodell and Famiglietti,<br />
2002; Han et al., 2005; Yirdaw et al., 2008; Zaitchik et al., 2008; Leblanc et al., 2009; Famiglietti et al., 2011). S<strong>in</strong>ce<br />
its launch <strong>in</strong> March 2002, GRACE has recorded gravity anomalies at monthly time <strong>in</strong>tervals us<strong>in</strong>g tw<strong>in</strong> satellites<br />
that travel 220 km apart <strong>in</strong> identical orbits. Variations <strong>in</strong> the distance between the two satellites <strong>in</strong>dicate deviations<br />
<strong>in</strong> the earth’s gravitational field, which can be attributed to variations <strong>in</strong> total water <strong>storage</strong> (TWS) over a specific<br />
area (NASA, 2002).<br />
Groundwater <strong>storage</strong> <strong>changes</strong> are difficult to estimate given the spatial and temporal limitations <strong>of</strong> obta<strong>in</strong><strong>in</strong>g<br />
complete and accurate <strong>groundwater</strong> level measurements for large geographic regions. However, the TWS anomalies<br />
measured by GRACE are representative <strong>of</strong> variations <strong>in</strong> snow and ice<br />
cover, surface water <strong>storage</strong>, soil moisture, and <strong>groundwater</strong> <strong>storage</strong><br />
(NASA, 2002). As a result, <strong>changes</strong> <strong>in</strong> <strong>groundwater</strong> can be estimated<br />
by subtract<strong>in</strong>g <strong>changes</strong> <strong>in</strong> <strong>storage</strong> for snow pack, surface water<br />
<strong>storage</strong>, and soil moisture from TWS.<br />
The goals <strong>of</strong> this study were first, to calculate <strong>changes</strong> <strong>in</strong><br />
<strong>groundwater</strong> <strong>storage</strong> for, the Sacramento River Bas<strong>in</strong>, the San Joaqu<strong>in</strong><br />
River Bas<strong>in</strong>, and the Central Valley us<strong>in</strong>g GRACE TWS anomalies<br />
and additional water <strong>storage</strong> components; and second, to compare<br />
<strong>changes</strong> <strong>in</strong> <strong>groundwater</strong> <strong>storage</strong> estimates from GRACE to estimates<br />
derived from C2VSIM.<br />
Study Area<br />
The Central Valley aquifer <strong>of</strong> California (on average 80 km wide<br />
and 650 km <strong>in</strong> length) is a structural trough filled with mar<strong>in</strong>e and<br />
cont<strong>in</strong>ental sediments (Planert and Williams, 1995). The aquifer is<br />
bounded on the west by the Coast Ranges and the east by the Sierra<br />
Nevada and is composed <strong>of</strong> sand and gravel, with significant amounts<br />
<strong>of</strong> silt and clay (Planert and Williams, 1995). The Central Valley<br />
aquifer is conta<strong>in</strong>ed with<strong>in</strong> three hydrologic regions–the Sacramento<br />
River Bas<strong>in</strong>, the San Joaqu<strong>in</strong> River Bas<strong>in</strong>, and the Tulare Lake Bas<strong>in</strong><br />
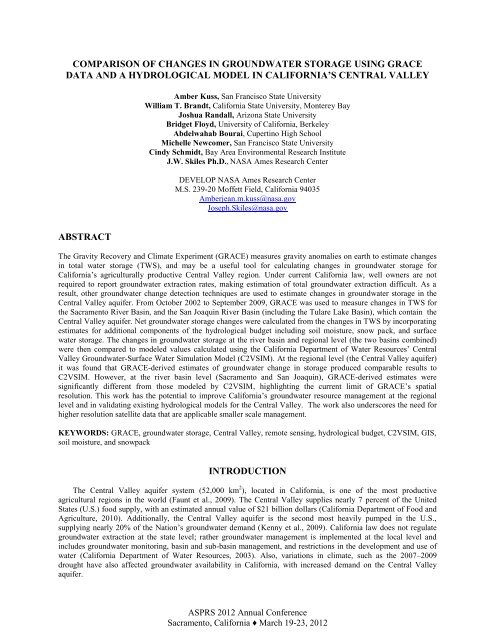
(Figure 1). For this study, the San Joaqu<strong>in</strong> River Bas<strong>in</strong> and Tulare<br />
Lake Bas<strong>in</strong> were comb<strong>in</strong>ed and throughout this paper will be referred<br />
to as the San Joaqu<strong>in</strong> River Bas<strong>in</strong>. The C2VSIM model also<br />
<strong>in</strong>corporates <strong>in</strong>flow from the hydrologic regions us<strong>in</strong>g multiple<br />
gauged river <strong>in</strong>flows <strong>in</strong>to the Central Valley aquifer (Brush et al.,<br />
2008). This <strong>in</strong>flow <strong>in</strong>cludes watersheds located <strong>in</strong> the Sierra Nevada<br />
with<strong>in</strong> the def<strong>in</strong>ed boundaries <strong>of</strong> the Sacramento and San Joaqu<strong>in</strong><br />
hydrologic regions, thus <strong>in</strong>corporat<strong>in</strong>g <strong>changes</strong> with<strong>in</strong> a similar area<br />
to GRACE data.<br />
GRACE data were obta<strong>in</strong>ed <strong>in</strong> hydrologic bas<strong>in</strong> boundaries that<br />
were predef<strong>in</strong>ed by the Cooperative Institute for Research <strong>in</strong><br />
Environmental Studies (CIRES) at the University <strong>of</strong> Colorado (CU).<br />
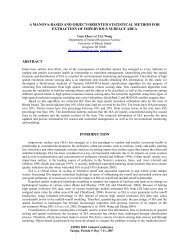
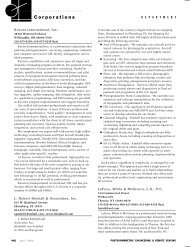
Figure 1. The study area, highlight<strong>in</strong>g<br />
the Central Valley region and the<br />
Sacramento Hydrologic Region (HR)<br />
which corresponds to the Sacramento<br />
River Bas<strong>in</strong>, and the San Joaqu<strong>in</strong> River<br />
(<strong>in</strong>clud<strong>in</strong>g the Tulare Lake) HRs are<br />
comb<strong>in</strong>ed as part <strong>of</strong> the San Joaqu<strong>in</strong><br />
River Bas<strong>in</strong>. The Central Valley aquifer<br />
is outl<strong>in</strong>ed <strong>in</strong> black and is the study area<br />
for which, C2VSIM calculates<br />
<strong>groundwater</strong> <strong>storage</strong> <strong>changes</strong>.<br />
Monthly TWS estimates were calculated us<strong>in</strong>g the Design <strong>of</strong> Total Run<strong>of</strong>f Integrat<strong>in</strong>g Pathways (TRIP) model and<br />
were found to be representative <strong>of</strong> the DWR hydrologic regions 5 (Sacramento River Bas<strong>in</strong>), 6 (San Joaqu<strong>in</strong> River<br />
Bas<strong>in</strong>), and 7(Tulare Lake Bas<strong>in</strong>) with 6 and 7 be<strong>in</strong>g comb<strong>in</strong>ed <strong>in</strong>to one region (Oki and Sud, 1998). While the<br />
hydrologic regions (comb<strong>in</strong>ed area <strong>of</strong> 152,254 km 2 ) differ significantly <strong>in</strong> size from the DWR modeled Central<br />
ASPRS 2012 Annual Conference<br />
Sacramento, California ♦ March 19-23, 2012
Valley aquifer (52,000 km 2 ), it was assumed that <strong>groundwater</strong> <strong>changes</strong> outside the aquifer would be m<strong>in</strong>imal given<br />
that the Sierra Nevada mounta<strong>in</strong> range is not conducive to <strong>groundwater</strong> <strong>storage</strong> (Famiglietti et al., 2011).<br />
METHODOLOGY<br />
Monthly GRACE TWS anomalies (TWS α,GRACE ) were obta<strong>in</strong>ed for the Sacramento River Bas<strong>in</strong> and the San<br />
Joaqu<strong>in</strong> River Bas<strong>in</strong> (<strong>in</strong>clud<strong>in</strong>g the Tulare Lake Bas<strong>in</strong>) <strong>in</strong> 84 monthly time <strong>in</strong>tervals from October 2002 to<br />
September 2009 (CU, 2011). Values were converted from totals <strong>in</strong>to anomalies by subtract<strong>in</strong>g the mean <strong>of</strong> the time<br />
series from each monthly value. To validate GRACE, monthly <strong>changes</strong> <strong>in</strong> TWS anomalies were calculated and<br />
compared to a separate water budget equation for the Central Valley (hydrologic regions 5, 6 and 7). The monthly<br />
<strong>changes</strong> <strong>in</strong> GRACE TWS anomalies were calculated us<strong>in</strong>g the equation:<br />
Equation (1)<br />
( ) ( )<br />
where:<br />
∆TWS α,GRACE = change <strong>in</strong> total water <strong>storage</strong> anomalies derived from GRACE<br />
TWS α,GRACE (t 1 ) = total water <strong>storage</strong> anomaly at time period one<br />
TWS α,GRACE (t 2 ) = total water <strong>storage</strong> anomaly at time period two<br />
An <strong>in</strong>dependent water balance equation was then constructed for the Central Valley us<strong>in</strong>g a hydrologic <strong>in</strong>put<br />
m<strong>in</strong>us output approach where ∆TWS Budget is the TWS change over the study period:<br />
Equation (2)<br />
( )<br />
where:<br />
∆TWS Budget = change <strong>in</strong> total water <strong>storage</strong><br />
P = total monthly precipitation<br />
ET = total monthly evapotranspiration<br />
Q = total monthly surface water discharge<br />
∆TWS α,GRACE was then compared with ∆TWS Budget :<br />
To calculate <strong>groundwater</strong> <strong>storage</strong> anomalies (GW α ), auxiliary datasets for soil moisture, surface water <strong>storage</strong>,<br />
and snowpack were required. Monthly anomalies for soil moisture (SM α ), surface water (SW α ) and snow pack (SP α )<br />
were then subtracted from monthly TWS α,GRACE values to calculate monthly GW α for the Central Valley, the<br />
Sacramento River Bas<strong>in</strong>, and the San Joaqu<strong>in</strong> River Bas<strong>in</strong>:<br />
Equation (3)<br />
( )<br />
where:<br />
GW α = <strong>groundwater</strong> <strong>storage</strong> anomaly<br />
TWS α = total water <strong>storage</strong> anomaly<br />
SW α = surface water <strong>storage</strong> anomaly<br />
SM α = soil moisture <strong>storage</strong> anomaly<br />
SP α = snowpack <strong>storage</strong> anomaly<br />
Changes <strong>in</strong> <strong>storage</strong> were then calculated for each <strong>of</strong> the anomalies TWS, SW, SM, SP, and GW over the length<br />
<strong>of</strong> the study period. Anomalies were plotted and a trend l<strong>in</strong>e was fitted. The slopes <strong>of</strong> the graphs were then<br />
converted <strong>in</strong>to a total volume (<strong>in</strong> km 3 ) <strong>of</strong> water lost or ga<strong>in</strong>ed over the course <strong>of</strong> the study period.<br />
ASPRS 2012 Annual Conference<br />
Sacramento, California ♦ March 19-23, 2012
Data Sets<br />
Data were obta<strong>in</strong>ed for TWS, SM, SP, SW <strong>storage</strong>s and for P, ET, and for Q from various satellites and <strong>in</strong>-situ<br />
sensors and then converted <strong>in</strong>to anomaly values (Table 1).<br />
GRACE. For the study period, 84 months <strong>of</strong> level 3 destriped GRACE data were obta<strong>in</strong>ed from the University<br />
<strong>of</strong> Colorado’s (CU) GRACE Data Analysis Website <strong>in</strong> millimeters <strong>of</strong> equivalent water thickness over the<br />
Sacramento and the San Joaqu<strong>in</strong> River Bas<strong>in</strong>s (CU, 2011). Pre-process<strong>in</strong>g <strong>of</strong> the GRACE data was performed by the<br />
Center for Space Research (CSR) at the University <strong>of</strong> Texas, and the release code was CSR RL04-DS. Additionally,<br />
the Jet Propulsion Laboratory (JPL) created validation datasets.<br />
In brief, the GRACE process<strong>in</strong>g consisted <strong>of</strong> transform<strong>in</strong>g the raw distances between the tw<strong>in</strong> satellites <strong>in</strong>to sets<br />
<strong>of</strong> gravity field solutions which were truncated to degree 60 (Wahr et al. 2004). From each monthly solution the<br />
time-mean gravity was then removed and the solutions were converted <strong>in</strong>to millimeters <strong>of</strong> equivalent water<br />
thickness correspond<strong>in</strong>g to TWS α,GRACE . The data were then regionally averaged for the Sacramento and the San<br />
Joaqu<strong>in</strong> River Bas<strong>in</strong>s as def<strong>in</strong>ed by the TRIP model (Oki and Sud, 1998). To remove the noise that is <strong>in</strong>herent <strong>in</strong><br />
<strong>in</strong>termediate and short wavelength gravity, a Gaussian filter is <strong>of</strong>ten applied by the user upon download<strong>in</strong>g.<br />
However, as this step removes noise but also dampens the actual geophysical signal amplitudes, the gravity signals<br />
have to be rescaled to pre-smooth<strong>in</strong>g magnitudes with an appropriate scal<strong>in</strong>g factor (Whar et al., 1998; Whar et al.,<br />
2004; Landerer and Swenson, In Press). The scal<strong>in</strong>g factor is a function <strong>of</strong> the smooth<strong>in</strong>g radii (CU, 2011).<br />
The data were smoothed us<strong>in</strong>g a Gaussian filter at multiple smooth<strong>in</strong>g radii to assess the effects <strong>of</strong> the filter size<br />
on the GW <strong>storage</strong> <strong>changes</strong> at the Central Valley and river bas<strong>in</strong> scales (discussed below). Groundwater <strong>storage</strong><br />
Table 1. Variables used for this study, with data resolution and source.<br />
estimates were calculated with GRACE TWS values smoothed to 1000 km, 750 km, 300 km, 100 km, and 1km. It<br />
was decided a priori that the most appropriate smooth<strong>in</strong>g radius for the study area was 300 km. This radius<br />
exemplified variations <strong>in</strong> the TWS while limit<strong>in</strong>g the error.<br />
Precipitation. PRISM (Parameter-elevation Regressions on Independent Slopes Model) data for precipitation<br />
were derived from the Oregon State University’s climate research <strong>in</strong>itiative known as the PRISM Climate Group<br />
(PRISM, 2011) (Table 1). The PRISM dataset is a knowledge-based system that creates a digital grid <strong>of</strong> monthly<br />
climatic estimates based on po<strong>in</strong>t measurement <strong>of</strong> precipitation, temperature, and other parameters at a spatial<br />
resolution <strong>of</strong> 4 km (PRISM, 2011). Data were obta<strong>in</strong>ed and spatially averaged for the three hydrologic regions (The<br />
Sacramento River Bas<strong>in</strong>, the San Joaqu<strong>in</strong> River Bas<strong>in</strong>, and the Tulare Lake Bas<strong>in</strong>) us<strong>in</strong>g a Geographical Information<br />
System (GIS). Pixel values were then extracted, converted, and averaged monthly for the Sacramento and San<br />
Joaqu<strong>in</strong> River Bas<strong>in</strong>s and the Central Valley and used to validate GRACE ∆TWS estimates.<br />
Evapotranspiration. Evapotranspiration data were developed through the MODIS Global Evapotranspiration<br />
(MOD16) project <strong>of</strong> the Numerical Terradynamic Simulation Group (NTSG) at the University <strong>of</strong> Montana (Table 1)<br />
(Mu et al., 2011). The MOD16 project was funded by the NASA Earth Observ<strong>in</strong>g System (EOS) <strong>in</strong> an effort to<br />
provide a data set that estimated global evapotranspiration us<strong>in</strong>g an algorithm to convert surface reflectance <strong>in</strong>to<br />
evapotranspiration (Mu et al., 2011). The data were processed <strong>in</strong>to 1 km gridded monthly averages and consisted <strong>of</strong><br />
a representative value for evapotranspiration that <strong>in</strong>cluded evaporation from soil, ra<strong>in</strong> water <strong>in</strong>tercepted by plants,<br />
and plant transpiration (Mu et al., 2011). Additionally, an ArcGIS tool, developed by the Center for Research <strong>in</strong><br />
Water Resources located at the University <strong>of</strong> Texas-Aust<strong>in</strong> was used to format the data (CRWR, 2011). The data<br />
were then used to calculate monthly summations <strong>of</strong> evapotranspiration over the Sacramento and the San Joaqu<strong>in</strong><br />
River Bas<strong>in</strong>s and the Central Valley, and used to validate GRACE ∆TWS estimates.<br />
ASPRS 2012 Annual Conference<br />
Sacramento, California ♦ March 19-23, 2012
Discharge. Real time daily mean discharge data were obta<strong>in</strong>ed from the U.S. Geological Survey (USGS)<br />
National Water Information System (NWIS) for both the Sacramento River at Verona (11425500) and the San<br />
Joaqu<strong>in</strong> River at Vernalis Gages (11303500) (USGS, 2011). Gages were selected based on their proximity to the<br />
Sacramento-San Joaqu<strong>in</strong> River Delta <strong>in</strong> an attempt to record maximum run<strong>of</strong>f for the Sacramento and the San<br />
Joaqu<strong>in</strong> River Bas<strong>in</strong>s, with limited tidal <strong>in</strong>teraction. Discharge data <strong>in</strong> ft 3 s -1 were converted to km 3 mo -1 , and<br />
monthly totals were used <strong>in</strong> the water balance equation to validate GRACE ∆TWS estimates.<br />
Surface Water. Total <strong>storage</strong> estimates from the 20 largest reservoirs located with<strong>in</strong> the Central Valley region<br />
were obta<strong>in</strong>ed from the DWR California Data Exchange Center (CDEC) (CDEC, 2011). The monthly average<br />
<strong>storage</strong> values (acre-ft) were sorted based on capacity and location, and then summed to obta<strong>in</strong> monthly totals. The<br />
change <strong>in</strong> <strong>storage</strong> values were then calculated from the difference between the current and previous months, which<br />
represented the total change <strong>in</strong> all reservoirs for the Central Valley region. Changes <strong>in</strong> surface water were averaged<br />
and the mean was removed to obta<strong>in</strong> surface water anomalies that were then used to calculate GW .<br />
Soil Moisture. The AMSR-E sensor, on the EOS-Aqua satellite, was used to generate monthly <strong>changes</strong> <strong>in</strong> soil<br />
moisture at a 1 degree spatial resolution for the top 1 cm <strong>of</strong> the soil. Data were obta<strong>in</strong>ed from the National Snow and<br />
Ice Data Center (NSIDC), with units <strong>of</strong> g cm -3 <strong>of</strong> soil moisture (Njoku, 2009). Preprocess<strong>in</strong>g <strong>in</strong>cluded apply<strong>in</strong>g an<br />
algorithm to convert surface reflectance <strong>in</strong>to soil moisture estimates, which were then averaged over approximately<br />
12,300 km 2 (Njoku, 2009). These estimates were then downscaled to the Central Valley region and the river bas<strong>in</strong>s<br />
and the monthly averages were calculated and converted <strong>in</strong>to km 3 . Accuracy estimates were on average ± 0.06 g<br />
cm -3 (Njoku, 2009). In order to estimate the amount <strong>of</strong> soil moisture throughout the unsaturated zone, a simple depth<br />
to water estimate <strong>of</strong> approximately 15 m was assumed (Faunt et al., 2009), and the value obta<strong>in</strong>ed for the top 0.01 m<br />
was applied to the entire unsaturated zone. Although there are <strong>in</strong>herent errors with this assumption, soil moisture<br />
can be a significant contributor to TWS. As a result, when calculat<strong>in</strong>g GW us<strong>in</strong>g equation 3 it is important to use<br />
representative values <strong>of</strong> <strong>changes</strong> <strong>in</strong> soil moisture occurr<strong>in</strong>g <strong>in</strong> the entire unsaturated zone <strong>of</strong> the aquifer and not just<br />
the top 0.01 m. F<strong>in</strong>ally, <strong>changes</strong> <strong>in</strong> soil moisture were then averaged and the mean removed to obta<strong>in</strong> soil moisture<br />
anomalies that were then used <strong>in</strong> calculat<strong>in</strong>g GW .<br />
Snowpack. Snowpack data, obta<strong>in</strong>ed as snow water equivalent (SWE), are a product <strong>of</strong> the NOAA National<br />
Weather Service’s National Operational Hydrologic Remote Sens<strong>in</strong>g Center (NOHRSC) (NOAA, 2011). The<br />
model output comb<strong>in</strong>es data sets from airborne and satellite platforms with <strong>in</strong>-situ measurements <strong>in</strong> a comprehensive<br />
model beg<strong>in</strong>n<strong>in</strong>g on 1 October 2003. The NOHRSC SWE products were downloaded via the National Snow and Ice<br />
Data Center (NSIDC) with a 1 km spatial resolution and 24-hour temporal resolution. To m<strong>in</strong>imize the download<strong>in</strong>g<br />
time for the 7-year time period, the 15 th <strong>of</strong> every month was used as a representative SWE with the assumption that<br />
SWE would not vary extensively with<strong>in</strong> months. Data were then clipped to the Sacramento and the San Joaqu<strong>in</strong><br />
River Bas<strong>in</strong>s us<strong>in</strong>g a GIS. Individual pixel values were then multiplied by the area <strong>of</strong> the pixel and the values<br />
summed across the Central Valley and the two river bas<strong>in</strong>s. F<strong>in</strong>ally, <strong>changes</strong> <strong>in</strong> snow pack were then averaged and<br />
the mean removed to obta<strong>in</strong> snow pack anomalies that were then used to calculate GW .<br />
Errors<br />
GRACE satellite data possess two types <strong>of</strong> errors: the measurement error, which is <strong>in</strong>tr<strong>in</strong>sic <strong>in</strong> the tw<strong>in</strong><br />
satellites, and the leakage error. The monthly measurement error and the leakage error were obta<strong>in</strong>ed from the<br />
GRACE Tellus website as a separate geospatially referenced raster (Swenson and Whar, 2006). For both the<br />
measurement and leakage error, the values were averaged over the Sacramento and the San Joaqu<strong>in</strong> River Bas<strong>in</strong>s<br />
and the Central Valley. It should be noted that this was a best-estimate approximation <strong>of</strong> the errors, and recent<br />
studies suggest that the errors for smaller regions are correlated and may be larger than currently reported errors<br />
(Landerer and Swenson, In Press). Thus, for simplistic approximation <strong>of</strong> the errors <strong>in</strong> this study, the average error<br />
was used, although this is an area <strong>in</strong>tended for further study. The comb<strong>in</strong>ed measurement and leakage error are also<br />
a function <strong>of</strong> the smooth<strong>in</strong>g radius, which is used <strong>in</strong> reduc<strong>in</strong>g noisy short-wavelength gravity dur<strong>in</strong>g the preprocess<strong>in</strong>g<br />
steps for TWS. For this study, the comb<strong>in</strong>ed measurement and leakage error was found to be 1.01 km 3 ,<br />
1.00 km 3 , and 1.00 km 3 for the Sacramento River Bas<strong>in</strong>, and the San Joaqu<strong>in</strong> River Bas<strong>in</strong>, and the Central Valley,<br />
respectively. Additionally, an error <strong>of</strong> 15% was assumed for each <strong>of</strong> the hydrologic variables (surface water, soil<br />
moisture, and snow pack).<br />
In order to establish the error <strong>in</strong>volved with the <strong>groundwater</strong> estimates, the propagation <strong>of</strong> uncerta<strong>in</strong>ty rule for<br />
sums and differences was used (Meyer, 1975). This rule establishes the comb<strong>in</strong>ed uncerta<strong>in</strong>ties <strong>of</strong> each variable <strong>in</strong><br />
the calculation <strong>of</strong> <strong>changes</strong> <strong>in</strong> <strong>groundwater</strong> <strong>storage</strong> us<strong>in</strong>g the equation<br />
ASPRS 2012 Annual Conference<br />
Sacramento, California ♦ March 19-23, 2012
Equation (4)<br />
S<br />
GW<br />
<br />
S<br />
S<br />
2<br />
S<br />
2<br />
S<br />
2<br />
2 TWS SW SM SP<br />
where<br />
S TWS = standard error <strong>of</strong> total water <strong>storage</strong><br />
S SW = standard error <strong>of</strong> surface water <strong>storage</strong><br />
S SM = standard error <strong>of</strong> soil moisture<br />
S SP = standard error <strong>of</strong> snow pack<br />
These errors are then applied to the total <strong>changes</strong> <strong>in</strong> <strong>groundwater</strong> <strong>storage</strong> for GRACE-derived estimates. To<br />
compare C2VSIM to the GRACE-derived <strong>groundwater</strong> estimates, an error <strong>of</strong> 15% was also applied to the C2VSIMderived<br />
<strong>groundwater</strong> estimates.<br />
C2VSIM Model<br />
C2VSIM was developed by DWR, and is a f<strong>in</strong>ite-element hydrologic model built to estimate water <strong>storage</strong> <strong>in</strong><br />
the Central Valley aquifer (Brush et al., 2008; Miller et al., 2009). The model utilizes various parameters which<br />
<strong>in</strong>clude, but are not limited to precipitation, stream flow, evapotranspiration, subsidence, and beg<strong>in</strong>n<strong>in</strong>g and end<strong>in</strong>g<br />
<strong>groundwater</strong> <strong>storage</strong> for each month. Groundwater <strong>storage</strong> <strong>changes</strong> were first calculated and then converted to<br />
anomalies us<strong>in</strong>g the equation below:<br />
Equation (5)<br />
GW<br />
<br />
GW GW<br />
where<br />
GW α = <strong>groundwater</strong> anomaly<br />
GW= average <strong>groundwater</strong> <strong>storage</strong> value over the entire time period<br />
GW = <strong>groundwater</strong> <strong>storage</strong> for the month <strong>in</strong> consideration<br />
A l<strong>in</strong>ear trend was then applied to the anomalies, and the slope used to calculate total <strong>groundwater</strong> <strong>storage</strong><br />
change over the study period for the Central Valley region and the Sacramento and San Joaqu<strong>in</strong> River Bas<strong>in</strong>s.<br />
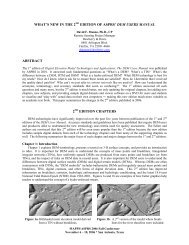
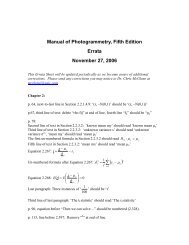
Hydrological Budget<br />
A hydrological budget was used to assess the<br />
accuracy <strong>of</strong> GRACE TWS estimates for the Central<br />
Valley region (Figure 2). Change <strong>in</strong> TWS was calculated<br />
us<strong>in</strong>g equation 1, and is represented <strong>in</strong> units <strong>of</strong> km 3<br />
month -1 to compare with change <strong>in</strong> volume estimates<br />
from the hydrologic budget equation. Both the<br />
magnitude and the seasonality <strong>of</strong> the data for<br />
TWS GRACE and TWS Budget agreed well, with<br />
significance at an = 0.05. As a result, GRACE TWS<br />
values were shown to be representative <strong>of</strong> TWS <strong>changes</strong><br />
with<strong>in</strong> the system. This f<strong>in</strong>d<strong>in</strong>g is <strong>in</strong> agreement with the<br />
data presented by Famiglietti et al. 2011. The<br />
hydrological budget (ΔTWS Budget ) was calculated us<strong>in</strong>g<br />
precipitation, evapotranspiration and discharge; the<br />
results for these <strong>in</strong>dividual data sets are discussed below.<br />
The trends <strong>of</strong> the variables with<strong>in</strong> the hydrological<br />
budget equations are exam<strong>in</strong>ed as <strong>in</strong>dication <strong>of</strong> the<br />
variations <strong>in</strong> climate associated with the study period.<br />
Precipitation was consistently the largest<br />
RESULTS<br />
Figure 2. A <strong>comparison</strong> <strong>of</strong> ΔTWS GRACE for the 300 km<br />
smooth<strong>in</strong>g radius and ΔTWS Budget from the hydrological<br />
budget equation.<br />
contributor to ΔTWS Budget . The Sacramento River Bas<strong>in</strong> exhibited the largest amount <strong>of</strong> precipitation. Strong<br />
seasonal trends <strong>in</strong> both river bas<strong>in</strong>s were apparent, with the largest amount <strong>of</strong> precipitation occurr<strong>in</strong>g between<br />
ASPRS 2012 Annual Conference<br />
Sacramento, California ♦ March 19-23, 2012
December and April dur<strong>in</strong>g the region’s w<strong>in</strong>ter storm period with a range <strong>of</strong> 14.54 km 3 –25.83 km 3 . These results<br />
reflect the drought period from 2007–2009 follow<strong>in</strong>g the above average precipitation year <strong>of</strong> 2006. The Sacramento<br />
River Bas<strong>in</strong> experienced the largest loss <strong>in</strong> total evapotranspiration followed by the San Joaqu<strong>in</strong> River Bas<strong>in</strong>. As<br />
would be expected, evapotranspiration exhibited seasonal trends with the largest evapotranspiration values occurr<strong>in</strong>g<br />
<strong>in</strong> late spr<strong>in</strong>g to early summer (May, June, and July), and the lowest values dur<strong>in</strong>g the w<strong>in</strong>ter months (December and<br />
January). The Sacramento River Bas<strong>in</strong>, <strong>in</strong> <strong>comparison</strong> with the San Joaqu<strong>in</strong> River Bas<strong>in</strong>, consistently produced<br />
greater discharge. Discharge also exhibited seasonal trends that peaked between February and April (<strong>in</strong> occurrence<br />
with snow melt from the Sierras) before steadily decl<strong>in</strong><strong>in</strong>g through the months <strong>of</strong> June and December. The range <strong>of</strong><br />
discharge varied from 1.63–6.89 km 3 <strong>in</strong> both the Sacramento and San Joaqu<strong>in</strong> rivers.<br />
Storage Anomalies<br />
GRACE TWS anomalies exhibited similar trends for the Sacramento River Bas<strong>in</strong>, the San Joaqu<strong>in</strong> River Bas<strong>in</strong>,<br />
and the Central Valley region. Storage anomalies <strong>in</strong>creased after the w<strong>in</strong>ter ra<strong>in</strong>s and rapidly decreased throughout<br />
the drier summer months (Figure 3A). The Central Valley region produced the largest standard deviations about the<br />
mean (0.72 km 3 ± 19.05) followed by the San Joaqu<strong>in</strong> (0.35 km 3 ± 9.86) and Sacramento (0.37 km 3 ± 9.55),<br />
respectively. Surface water <strong>storage</strong> anomalies demonstrated similar seasonal trends (Figure 3B). In general, surface<br />
water <strong>storage</strong> anomalies <strong>in</strong>creased between 2002 and 2006, before decreas<strong>in</strong>g at the onset <strong>of</strong> the drought period<br />
beg<strong>in</strong>n<strong>in</strong>g <strong>in</strong> 2007. Soil moisture <strong>storage</strong> anomalies also exhibited seasonal trends that <strong>in</strong>creased dur<strong>in</strong>g the w<strong>in</strong>ter<br />
months and decreased dur<strong>in</strong>g the drier summer months (Figure 3B). In general, the Sacramento and San Joaqu<strong>in</strong><br />
River Bas<strong>in</strong>s and the Central Valley displayed similar values (both <strong>in</strong> magnitude and seasonality) throughout the<br />
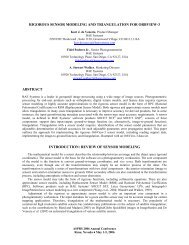
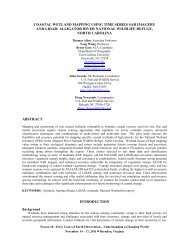
Figure 3. Hydrologic variable anomalies. (A) TWS anomalies from GRACE, (B) surface water <strong>storage</strong> anomalies<br />
from CDEC, (C) soil moisture <strong>storage</strong> anomalies from AMSR-E, and (D) snow pack anomalies from NOAA.<br />
length <strong>of</strong> the study. Snowpack <strong>storage</strong> anomalies exhibited pronounced w<strong>in</strong>ter and summer variations (Figure 3C).<br />
The w<strong>in</strong>ters between 2004 and 2006 produced the largest snowpack totals dur<strong>in</strong>g the study period. Interest<strong>in</strong>gly, the<br />
Sacramento and San Joaqu<strong>in</strong> River Bas<strong>in</strong>s exhibited conflict<strong>in</strong>g anomaly trends with anomaly values <strong>in</strong>creas<strong>in</strong>g for<br />
the Sacramento River Bas<strong>in</strong> through the duration <strong>of</strong> the study period (with the exception <strong>of</strong> the w<strong>in</strong>ter <strong>in</strong> 2006–<br />
2007) (Figure 3D). However, <strong>in</strong> the San Joaqu<strong>in</strong> River Bas<strong>in</strong>, snowpack anomalies <strong>in</strong>creased until the w<strong>in</strong>ter <strong>of</strong><br />
2005–2006 before exhibit<strong>in</strong>g a sharp and notable decrease for the rest <strong>of</strong> the study period. The Central Valley and<br />
the San Joaqu<strong>in</strong> River Bas<strong>in</strong> exhibit the largest seasonal fluctuations and differ significantly from the Sacramento<br />
ASPRS 2012 Annual Conference<br />
Sacramento, California ♦ March 19-23, 2012
<strong>groundwater</strong> <strong>storage</strong> anomalies. The onset <strong>of</strong> the drought period beg<strong>in</strong>n<strong>in</strong>g <strong>in</strong> 2007 is especially visible <strong>in</strong> the San<br />
Joaqu<strong>in</strong> River Bas<strong>in</strong>, but difficult to discern <strong>in</strong> the Sacramento River Bas<strong>in</strong>.<br />
The San Joaqu<strong>in</strong> River Bas<strong>in</strong> exhibited the largest loss <strong>in</strong> TWS, snowpack and <strong>groundwater</strong> <strong>storage</strong> anomalies<br />
(Table 2). In contrast, the Sacramento River Bas<strong>in</strong> displayed the largest loss <strong>in</strong> surface water <strong>storage</strong>. Soil moisture<br />
<strong>storage</strong> values, however, rema<strong>in</strong>ed relatively unchanged throughout the study period <strong>in</strong> both regions. The results<br />
presented here are consistent with the results presented by Famiglietti et al. 2011 and Faunt et al. 2009.<br />
C2VSIM Change <strong>in</strong> Storage<br />
C2VSIM calculated change <strong>in</strong> <strong>groundwater</strong> <strong>storage</strong> exhibited seasonal variability and a negative overall trend<br />
(Figure 4). The net change <strong>in</strong> <strong>storage</strong> for the Central Valley aquifer was -17.56 ± 2.63 km 3 (-14.24 ± 2.13 million<br />
acre-feet). The San Joaqu<strong>in</strong> River Bas<strong>in</strong> exhibited a loss <strong>of</strong> -15.01 ± 2.25 km 3 (12 million acre feet) and the<br />
Sacramento River Bas<strong>in</strong> exhibited a net decrease <strong>of</strong> -2.55 ± 0.38 km 3 (2 million acre-feet). The largest positive<br />
change <strong>in</strong> <strong>groundwater</strong> <strong>storage</strong> occurred <strong>in</strong> December 2005 (0.35 ± 0.05 km 3 ) and January 2006 (0.34 ± 0.05 km 3 ).<br />
The largest negative change <strong>in</strong> <strong>groundwater</strong> <strong>storage</strong> occurred <strong>in</strong> July 2008 (-0.45 ± 0.07 km 3 ) followed by July 2009<br />
(-0.44 ± 0.07 km 3 ).<br />
Table 2. Change <strong>in</strong> <strong>storage</strong> from October 2002 to September 2009 for total water <strong>storage</strong>, soil<br />
moisture, surface water <strong>storage</strong>, snow pack <strong>storage</strong>, and <strong>groundwater</strong> <strong>storage</strong>.<br />
DISCUSSION<br />
GRACE and C2VSIM <strong>groundwater</strong> <strong>storage</strong><br />
anomalies exhibited similar trends for the Central<br />
Valley region from October 2002 through September<br />
2009 (Figure 4). This f<strong>in</strong>d<strong>in</strong>g is important as it<br />
validates the usefulness <strong>of</strong> GRACE at scales <strong>of</strong> ≥<br />
150,000 km 2 . It should be noted that GRACE and<br />
C2VSIM <strong>groundwater</strong> anomalies display marked<br />
differences dur<strong>in</strong>g the seasonal peaks and troughs.<br />
GRACE is more variable and covers a larger<br />
geographic area which may <strong>in</strong>clude <strong>changes</strong> <strong>in</strong> water<br />
<strong>storage</strong> outside the Central Valley aquifer. This<br />
characteristic may be a due to the coarse spatial<br />
resolution <strong>of</strong> GRACE. Small spatial scales comb<strong>in</strong>ed<br />
with small <strong>changes</strong> <strong>in</strong> TWS may make separat<strong>in</strong>g the<br />
differences between noise and short gravitational<br />
wavelength’s difficult. Regardless, both methods<br />
clearly document the California drought period<br />
beg<strong>in</strong>n<strong>in</strong>g <strong>in</strong> 2007 with the data tak<strong>in</strong>g on a dist<strong>in</strong>ctive<br />
negative trend.<br />
Figure 4. Groundwater <strong>storage</strong> anomalies from GRACE<br />
and C2VSIM with l<strong>in</strong>ear trendl<strong>in</strong>es. Of note is the<br />
significant decrease <strong>in</strong> ∆GW at the onset <strong>of</strong> the California<br />
wide drought beg<strong>in</strong>n<strong>in</strong>g <strong>in</strong> 2007.<br />
ASPRS 2012 Annual Conference<br />
Sacramento, California ♦ March 19-23, 2012
Both GRACE and C2VSIM produced comparable results for change <strong>in</strong> <strong>groundwater</strong> <strong>storage</strong> over the study<br />
period for the Central Valley region; however, results were significantly different for the Sacramento and San<br />
Joaqu<strong>in</strong> River Bas<strong>in</strong>s (Figure 5). At the Central Valley aquifer scale, GRACE estimated change <strong>in</strong> <strong>groundwater</strong> <strong>of</strong><br />
-14.47 ± 1.45 km 3 compared to<br />
C2VSIM’s estimate <strong>of</strong><br />
-17.56 ± 2.63 km 3 . While, the<br />
estimates are different (by about<br />
18%), they are with<strong>in</strong> the accepted<br />
errors and therefore comparable.<br />
However, at the river bas<strong>in</strong> scale both<br />
GRACE and C2VSIM produced very<br />
different results when us<strong>in</strong>g the 300<br />
km smooth<strong>in</strong>g radius. The GRACEderived<br />
estimate for total change <strong>in</strong><br />
<strong>groundwater</strong> <strong>storage</strong> for the<br />
Sacramento River Bas<strong>in</strong> was -7.70 ±<br />
1.49 km 3 ; whereas C2VSIM<br />
estimated losses <strong>of</strong> -2.55 ± 0.38 km 3 .<br />
For the San Joaqu<strong>in</strong> River Bas<strong>in</strong>,<br />
GRACE estimated losses <strong>of</strong> -6.76 ±<br />
1.45 km 3 and C2VSIM estimated a<br />
loss <strong>of</strong> -15.01 ± 2.25 km 3 . These data<br />
highlight the resolution limitations <strong>of</strong><br />
GRACE, especially <strong>in</strong> small bas<strong>in</strong> or<br />
sub-bas<strong>in</strong> analyses.<br />
GRACE-derived change <strong>in</strong> <strong>groundwater</strong> <strong>storage</strong> estimates exhibited high variability depend<strong>in</strong>g on the Gaussian<br />
smooth<strong>in</strong>g radius used. When us<strong>in</strong>g a smaller smooth<strong>in</strong>g radius, the differences between the Sacramento and San<br />
Joaqu<strong>in</strong> River Bas<strong>in</strong>s become more pronounced and seem<strong>in</strong>gly more accurate given the results from C2VSIM.<br />
Additionally, the monthly GRACE <strong>groundwater</strong> <strong>storage</strong> anomalies for smaller smooth<strong>in</strong>g radii were found to be<br />
more characteristic <strong>of</strong> the variations <strong>in</strong> climate, such as the onset <strong>of</strong> the drought <strong>in</strong> 2007. Although the <strong>groundwater</strong><br />
<strong>storage</strong> estimates derived with a smaller smooth<strong>in</strong>g radius are closer to previously reported values, the error<br />
<strong>in</strong>volved is currently unknown. It is<br />
assumed that the error would<br />
<strong>in</strong>crease significantly with a<br />
decreas<strong>in</strong>g smooth<strong>in</strong>g radius,<br />
therefore produc<strong>in</strong>g unclear results.<br />
However, an <strong>in</strong>terest<strong>in</strong>g trend <strong>in</strong><br />
change <strong>in</strong> <strong>groundwater</strong> <strong>storage</strong> for<br />
various smooth<strong>in</strong>g radii suggests<br />
that an equilibrium po<strong>in</strong>t is<br />
approached with progressively<br />
smaller radii (Figure 6). For<br />
example, there is a difference <strong>of</strong><br />
6.41 km 3 between the <strong>groundwater</strong><br />
<strong>storage</strong> estimate with a smooth<strong>in</strong>g<br />
radius <strong>of</strong> 750 km and 300 km, but<br />
there is only a 0.49 km 3 difference<br />
between 100 km and 1 km<br />
smooth<strong>in</strong>g, due to use <strong>of</strong> degree 60<br />
data, which produces little<br />
Figure 6. GRACE-derived <strong>groundwater</strong> <strong>storage</strong> estimates for the study<br />
period with different smooth<strong>in</strong>g radii for A) 1000 km, B) 750 km, C) 100<br />
km, and D) 1 km. It is important to note the large sw<strong>in</strong>gs <strong>in</strong> ∆GW for the<br />
river bas<strong>in</strong>s; especially above a 100 km smooth<strong>in</strong>g radius.<br />
Figure 5. Changes <strong>in</strong> <strong>groundwater</strong> for the Sacramento River Bas<strong>in</strong>, the<br />
San Joaqu<strong>in</strong> River Bas<strong>in</strong>, and the Central Valley aquifer for GRACE and<br />
C2VSIM.<br />
difference <strong>in</strong> 100 km and 1km<br />
<strong>groundwater</strong> <strong>storage</strong> estimates.<br />
These f<strong>in</strong>d<strong>in</strong>gs prove helpful <strong>in</strong><br />
downscal<strong>in</strong>g efforts to smaller areas<br />
similar to that <strong>of</strong> the river bas<strong>in</strong>s.<br />
ASPRS 2012 Annual Conference<br />
Sacramento, California ♦ March 19-23, 2012
Although both GRACE and C2VSIM estimate significant decl<strong>in</strong>es <strong>in</strong> <strong>groundwater</strong> <strong>storage</strong>, the period <strong>of</strong> record<br />
is an important factor <strong>in</strong> the results presented here. Periods <strong>of</strong> <strong>in</strong>creased or decreased precipitation due to natural<br />
climate variability will affect <strong>changes</strong> <strong>in</strong> <strong>groundwater</strong> <strong>storage</strong> <strong>in</strong> the Central Valley aquifer. This study period<br />
<strong>in</strong>cluded a moderate drought, which greatly affected the <strong>groundwater</strong> depletion trends. Prior to the onset <strong>of</strong> the<br />
2007–2009 drought, there were no significant <strong>changes</strong> <strong>in</strong> <strong>groundwater</strong> <strong>storage</strong>, as also noted by Famiglietti et al.<br />
2011. Thus, it is important to generate trends <strong>in</strong> <strong>groundwater</strong> <strong>storage</strong> over a long enough time period to identify<br />
natural variability <strong>in</strong> climate. GRACE and C2VSIM data display these trends and therefore are useful tools for<br />
<strong>groundwater</strong> <strong>storage</strong> monitor<strong>in</strong>g and management <strong>in</strong> the Central Valley aquifer.<br />
CONCLUSION<br />
The goals <strong>of</strong> this study were to 1) calculate the change <strong>in</strong> <strong>groundwater</strong> <strong>storage</strong> for the Sacramento River Bas<strong>in</strong>,<br />
the San Joaqu<strong>in</strong> River Bas<strong>in</strong>, and the Central Valley us<strong>in</strong>g GRACE TWS anomalies and additional water <strong>storage</strong><br />
components; and 2) to compare total change <strong>in</strong> <strong>groundwater</strong> <strong>storage</strong> estimates for both GRACE and C2VSIM. In<br />
order to address the first goal <strong>of</strong> this study, GRACE TWS anomalies were used to calculate change <strong>in</strong> <strong>groundwater</strong><br />
<strong>storage</strong>. This was calculated by subtract<strong>in</strong>g the monthly anomalies <strong>of</strong> water <strong>storage</strong> (surface water, soil moisture,<br />
and snowpack) from the monthly GRACE TWS anomaly. Additional water <strong>storage</strong> anomalies were calculated from<br />
reservoir <strong>storage</strong> data from CDEC (surface water), soil moisture values from AMSR-E and an <strong>in</strong>tegration <strong>of</strong> soil<br />
moisture throughout the unsaturated zone, and from snowpack data from NOAA. A l<strong>in</strong>ear trend <strong>of</strong> monthly<br />
<strong>groundwater</strong> <strong>storage</strong> anomalies was used to estimate total change <strong>in</strong> <strong>groundwater</strong> <strong>storage</strong> for the study period<br />
(October 2002–Spetember 2009). To address the second goal <strong>of</strong> the study, <strong>groundwater</strong> <strong>storage</strong> anomalies from<br />
C2VSIM were also calculated from modeled outputs and a trend was used to estimate total change <strong>in</strong> <strong>groundwater</strong><br />
<strong>storage</strong>.<br />
A major factor <strong>in</strong> calculat<strong>in</strong>g change <strong>in</strong> <strong>groundwater</strong> <strong>storage</strong> estimates from GRACE data was the ability to use<br />
a variety <strong>of</strong> smooth<strong>in</strong>g radii. The process<strong>in</strong>g <strong>of</strong> GRACE data can greatly affect change <strong>in</strong> <strong>groundwater</strong> <strong>storage</strong><br />
estimates, and different smooth<strong>in</strong>g radii produced dramatically different results. For this study, a smooth<strong>in</strong>g radius<br />
<strong>of</strong> 300 km was chosen due to the size <strong>of</strong> the study area and the acceptable level <strong>of</strong> associated error. However, it<br />
should be noted that smooth<strong>in</strong>g radii <strong>of</strong> 1,000 km, 750 km, 100 km, and 1 km were also used to report total change<br />
<strong>in</strong> <strong>groundwater</strong> <strong>storage</strong>. The change <strong>in</strong> <strong>groundwater</strong> <strong>storage</strong> estimates for smaller smooth<strong>in</strong>g radii produced results<br />
similar to C2VSIM and previously reported values, although the associated error is unknown. Due to the unknown<br />
errors for the 100 km and 1km smooth<strong>in</strong>g radii, discretion at larger scales is recommended. Thus, GRACE proved<br />
effective at estimat<strong>in</strong>g change <strong>in</strong> <strong>groundwater</strong> <strong>storage</strong> at the Central Valley region scale. However, at smaller scales<br />
the satellite is not sensitive enough to separate the differences occurr<strong>in</strong>g at the river bas<strong>in</strong> level.<br />
For the 300 km smooth<strong>in</strong>g radius, both GRACE and C2VSIM produced comparable results for the Central<br />
Valley region exhibit<strong>in</strong>g a net loss <strong>in</strong> change <strong>in</strong> <strong>groundwater</strong> <strong>storage</strong> <strong>of</strong> -14.47 ± 1.49 km³ and -17.56 ± 2.63 km³ for<br />
GRACE and C2VSIM, respectively. This loss occurred over the 7-year study period (October 2002–September<br />
2009). However, the two methods differed <strong>in</strong> their estimates <strong>of</strong> change <strong>in</strong> <strong>groundwater</strong> <strong>storage</strong> loss at the bas<strong>in</strong><br />
scale when us<strong>in</strong>g a smooth<strong>in</strong>g radius ≥ 300 km. This result emphasizes the usefulness <strong>of</strong> GRACE for large-scale<br />
bas<strong>in</strong>s greater than or equal to bas<strong>in</strong>s <strong>of</strong> 150,000 km 2 and also highlights the limits <strong>of</strong> the satellite for water resource<br />
management at bas<strong>in</strong> or sub-bas<strong>in</strong> scales. It was found that GRACE data at f<strong>in</strong>er spatial scales must be processed<br />
and evaluated differently through the assimilation <strong>of</strong> GRACE-data <strong>in</strong>to hydrologic models. This study shows that<br />
current water resource management practices provide the most accurate estimates <strong>of</strong> change <strong>in</strong> <strong>groundwater</strong> <strong>storage</strong><br />
at the bas<strong>in</strong> and sub-bas<strong>in</strong> scale. GRACE data are an effective water resources management tool for large bas<strong>in</strong>s<br />
equal to or greater than the size <strong>of</strong> the Central Valley aquifer.<br />
ACKNOWLEDGEMENTS<br />
We thank the Department <strong>of</strong> Water Resources, notably the people who supported us throughout this project,<br />
Mary Scruggs, Abdul Khan, Charles Brush, Bill Brewster, and Chris Bonds. We also thank Stephen Kashiwada for<br />
the tour <strong>of</strong> the California State Water Project. We also thank K<strong>in</strong>gs River Conservation District, notably David Orth,<br />
Eric Osterl<strong>in</strong>g, and Cristel Tufenkjian, for the <strong>in</strong>sight <strong>in</strong>to local water management and the tour <strong>of</strong> the P<strong>in</strong>e Flat<br />
Dam.<br />
ASPRS 2012 Annual Conference<br />
Sacramento, California ♦ March 19-23, 2012
REFERENCES<br />
Brush, C.F., E.C. Dogrul, M.R. Moncrief, J. Galef, S. Shultz, M. Tonk<strong>in</strong>, D. Wendell, T.N. Kadir, and F.I. Chung.<br />
2008. Estimat<strong>in</strong>g hydrologic flow components <strong>of</strong> the Central Valley hydrologic flow system with the<br />
California Central Valley Groundwater-Surface Water Model. In CF Brush and NL Miller, eds.<br />
Proceed<strong>in</strong>gs <strong>of</strong> the California Central Valley Groundwater Model<strong>in</strong>g Workshop, July 10-11, 2008,<br />
Lawrence Berkeley National Laboratory, Berkeley, California. California Water and Environmental<br />
Model<strong>in</strong>g Forum, Sacramento, CA.<br />
California Department <strong>of</strong> Water Resources. 2003, California’s Groundwater Bullet<strong>in</strong> 118, Update 2003.<br />
Sacramento, CA. 265 pp.<br />
CDEC, 2011, Reservoir Data Summary, 1964 to 2011, Department <strong>of</strong> Water Resources California Data Exchange<br />
Center (CDEC), http://cdec.water.ca.gov/reservoir.html, Sacramento, CA, (Updated daily).<br />
CRWR, 2011, MODIS 16 GIS Tool, 2000 to 2011, The Center for Research <strong>in</strong> Water Resources at the University <strong>of</strong><br />
Texas at Aust<strong>in</strong>, http://data.crwr.utexas.edu/blog/news/historical-evapotranspiration-data/, Aust<strong>in</strong>, TX.<br />
CU, 2011. Real-Time GRACE Data Analysis Site, 2002 to 2009, University <strong>of</strong> Colorado Cooperative Institute for<br />
Research <strong>in</strong> Environmental Sciences. http://geoid.colorado.edu/<strong>grace</strong>/<strong>grace</strong>.php, Boulder, CO.<br />
Famiglietti, J. S., M. Lo, S. L. Ho, J. Bethune, K. J. Anderson, T. H. Syed, S. C. Swenson, C. R. de L<strong>in</strong>age, and M.<br />
Rodell. 2011. Satellites measure recent rates <strong>of</strong> <strong>groundwater</strong> depletion <strong>in</strong> California’s Central Valley, 38,<br />
L03403, doi:10.1029/2010GL046442.<br />
Faunt, C. C., R.T. Hanson, K. Belitz, W. Schmid, S.P. Predmore, D.L. Rewis, K. McPhearson, 2009. Groundwater<br />
availability <strong>of</strong> the central valley aquifer, California, US Geological Survey, Pr<strong>of</strong>essional Paper 1766, 225<br />
pp.<br />
Han, S. C., C. K. Shum, C. Jekeli, and D. Alsdorf. 2005. Improved estimation <strong>of</strong> terrestrial water <strong>storage</strong> <strong>changes</strong><br />
from GRACE, Geophys. Res. Lett, 32(7). L07302, doi:10.1029/2005GL022382.<br />
Kenny, J. F., N. L. Barber , S. S. Hutson, K. S. L<strong>in</strong>sey, J. K. Lovelace, and M. A. Maup<strong>in</strong>. 2009. Estimated Use <strong>of</strong><br />
Water <strong>in</strong> the United States <strong>in</strong> 2005. Reston, VA: U.S. Geological Survey Circular 1344. 52 pp.<br />
Landerer and Swensen, In Press. Accuracy <strong>of</strong> scaled GRACE terrestrial water <strong>storage</strong> estimates. Water Resources<br />
Research. 27pp.<br />
Leblanc, M. J., P. Tregon<strong>in</strong>g, G. Ramillien, S. O. Tweed, and A. Fakes. 2009. Bas<strong>in</strong>-scale, <strong>in</strong>tegrated observations<br />
<strong>of</strong> the early 21st century multiyear drought <strong>in</strong> southeast Australia, Water resources research, 45(1).<br />
Meyer, S.L., 1975, Data Analysis for Scientists and Eng<strong>in</strong>eers. John Wiley and Sons, Hoboken, New Jersey.<br />
Miller, NL, LL Dale, CF Brush, SD Vicuna, TN Kadir, EC Dogrul, and FI Chung, 2009. Drought resilience <strong>of</strong> the<br />
California Central Valley surface-<strong>groundwater</strong>-conveyance system. Journal <strong>of</strong> the American Water<br />
Resources Association. doi: 10.1111/j.1752-1688.2009.00329.x.<br />
Mu, Q., M. Zhao, and S. W. Runn<strong>in</strong>g. 2011. Improvements to a MODIS global terrestrial evapotranspiration<br />
algorithm, Remote Sens<strong>in</strong>g <strong>of</strong> Environment. 115. 1781–1800.<br />
NASA. 2002. Study<strong>in</strong>g the earth’s gravity from space: The Gravity Recovery and Climate Experiment (GRACE),<br />
National Areonautics and Space Adm<strong>in</strong>stration, Greenbelt, MD.<br />
Njoku, Eni. 2009, updated daily. AMSR-E/Aqua L2B Surface Soil Moisture, Ancillary Parms, & QC EASE-Grids<br />
V002, October 2002–September 2009, Boulder, Colorado USA: National Snow and Ice Data Center.<br />
Digital media.<br />
NOAA, 2011, National Snow Data, 2002 to 2011, National Operational Hydrologic Remote Sens<strong>in</strong>g Center,<br />
http://www.nohrsc.nws.gov/, Chanhassen, MN, (Updated daily).<br />
Oki, T., and Y. C. Sud. 1998. Design <strong>of</strong> Total Run<strong>of</strong>f Integrat<strong>in</strong>g Pathways (TRIP)—A Global River Channel<br />
Network, Earth Interact., 2(1), 1-37, doi:10.1175/1087-3562(1998)0022.3.CO;2.<br />
Planert, M., and J. Williams (1995), Ground water Atlas <strong>of</strong> the United States-California, Nevada, <strong>in</strong> Ground water<br />
Atlas <strong>of</strong> the United States, USGS, Wash<strong>in</strong>gton, D.C.<br />
PRISM, 2011. Near-Real-time Monthly High-Resolution Precipitation Climate Sate Set for the Conterm<strong>in</strong>ous<br />
United States. 1997 to 2011. The Prism Climate Group at Oregon State University.<br />
http://prism.oregonstate.edu, Corvallis, OR. (Updated daily).<br />
Rodell, M., and J. S. Famiglietti. 2002. The potential for satellite-based monitor<strong>in</strong>g <strong>of</strong> <strong>groundwater</strong> <strong>storage</strong> <strong>changes</strong><br />
us<strong>in</strong>g GRACE: the High Pla<strong>in</strong>s aquifer, Central US, Journal <strong>of</strong> Hydrology, 263(1-4), 245–256.<br />
Swenson, S., and J. Wahr, 2006, Post-process<strong>in</strong>g removal <strong>of</strong> correlated errors <strong>in</strong> GRACE data, Geophys. Res. Lett.,<br />
33(8), doi:10.1029/2005GL025285. [onl<strong>in</strong>e] Available from:<br />
http://<strong>grace</strong>.jpl.nasa.gov/data/<strong>grace</strong>monthlymassgridsland/ (Accessed 7 June 2011).<br />
ASPRS 2012 Annual Conference<br />
Sacramento, California ♦ March 19-23, 2012
USGS, 2011, Real-Time Water Data for the Nation: Daily Streamflow Conditions, National Water Information<br />
System (NWIS), http://waterdata.usgs.gov/nwis/rt, Wash<strong>in</strong>gton, DC, (Updated daily).<br />
Wahr, J., M. Molenaar, and F. Bryan. 1998. Time variability <strong>of</strong> the Earth’s gravity field: Hydrological and oceanic<br />
effects and their possible detection us<strong>in</strong>g GRACE, J. Geophys. Res., 103(B12), PP. 30,205-30,229,<br />
doi:199810.1029/98JB02844.<br />
Wahr, J., S. Swenson, V. Zlotnicki, and I. Velicogna. 2004. Time-variable gravity from GRACE: First results,<br />
Geophys. Res. Lett, 31(11), L11501.<br />
Yirdaw, S. Z., K. R. Snelgrove, and C. O. Agboma. 2008. GRACE satellite observations <strong>of</strong> terrestrial moisture<br />
<strong>changes</strong> for drought characterization <strong>in</strong> the Canadian Prairie, Journal <strong>of</strong> Hydrology, 356(1-2), 84–92.<br />
Zaitchik, B. F., M. Rodell, and R. H. Reichle. 2008. Assimilation <strong>of</strong> GRACE Terrestrial Water Storage Data <strong>in</strong>to a<br />
Land Surface Model: Results for the Mississippi River Bas<strong>in</strong>, J. Hydrometeor, 9(3), 535-548,<br />
doi:10.1175/2007JHM951.1.<br />
ASPRS 2012 Annual Conference<br />
Sacramento, California ♦ March 19-23, 2012