chapter 3 - Bentham Science
chapter 3 - Bentham Science
chapter 3 - Bentham Science

You also want an ePaper? Increase the reach of your titles
YUMPU automatically turns print PDFs into web optimized ePapers that Google loves.
108 Applications of Spreadsheets in Education The Amazing Power of a Simple Tool Sinex and Gage<br />
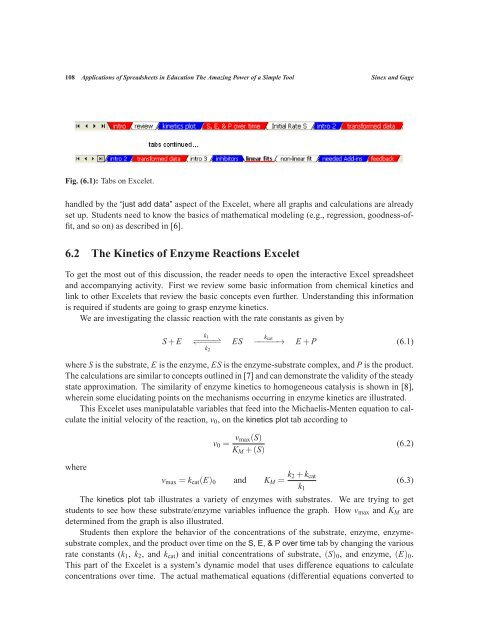
Fig. (6.1): Tabs on Excelet.<br />
handled by the “just add data” aspect of the Excelet, where all graphs and calculations are already<br />
set up. Students need to know the basics of mathematical modeling (e.g., regression, goodness-offit,<br />
and so on) as described in [6].<br />
6.2 The Kinetics of Enzyme Reactions Excelet<br />
To get the most out of this discussion, the reader needs to open the interactive Excel spreadsheet<br />
and accompanying activity. First we review some basic information from chemical kinetics and<br />
link to other Excelets that review the basic concepts even further. Understanding this information<br />
is required if students are going to grasp enzyme kinetics.<br />
We are investigating the classic reaction with the rate constants as given by<br />
S+E<br />
k1<br />
−−−−⇀ ↽−−−−<br />
k2<br />
ES<br />
kcat<br />
−−−−−→ E+ P (6.1)<br />
where S is the substrate, E is the enzyme, ES is the enzyme-substrate complex, and P is the product.<br />
The calculations are similar to concepts outlined in [7] and can demonstrate the validity of the steady<br />
state approximation. The similarity of enzyme kinetics to homogeneous catalysis is shown in [8],<br />
wherein some elucidating points on the mechanisms occurring in enzyme kinetics are illustrated.<br />
This Excelet uses manipulatable variables that feed into the Michaelis-Menten equation to calculate<br />
the initial velocity of the reaction, v0, on the kinetics plot tab according to<br />
where<br />
v0 = vmax(S)<br />
KM+(S)<br />
vmax = kcat(E)0 and KM = k2+ kcat<br />
The kinetics plot tab illustrates a variety of enzymes with substrates. We are trying to get<br />
students to see how these substrate/enzyme variables influence the graph. How vmax and KM are<br />
determined from the graph is also illustrated.<br />
Students then explore the behavior of the concentrations of the substrate, enzyme, enzymesubstrate<br />
complex, and the product over time on the S, E, & P over time tab by changing the various<br />
rate constants (k1, k2, and kcat) and initial concentrations of substrate, (S)0, and enzyme, (E)0.<br />
This part of the Excelet is a system’s dynamic model that uses difference equations to calculate<br />
concentrations over time. The actual mathematical equations (differential equations converted to<br />
k1<br />
(6.2)<br />
(6.3)