Annual Report - Chief Executive Office - Los Angeles County
Annual Report - Chief Executive Office - Los Angeles County
Annual Report - Chief Executive Office - Los Angeles County

You also want an ePaper? Increase the reach of your titles
YUMPU automatically turns print PDFs into web optimized ePapers that Google loves.
<strong>County</strong> of <strong>Los</strong> <strong>Angeles</strong> <strong>Annual</strong> <strong>Report</strong> 2006-2007<br />
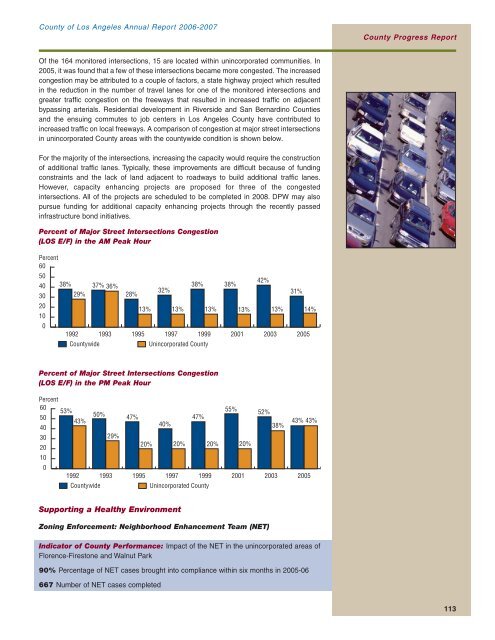
Of the 164 monitored intersections, 15 are located within unincorporated communities. In<br />
2005, it was found that a few of these intersections became more congested. The increased<br />
congestion may be attributed to a couple of factors, a state highway project which resulted<br />
in the reduction in the number of travel lanes for one of the monitored intersections and<br />
greater traffic congestion on the freeways that resulted in increased traffic on adjacent<br />
bypassing arterials. Residential development in Riverside and San Bernardino Counties<br />
and the ensuing commutes to job centers in <strong>Los</strong> <strong>Angeles</strong> <strong>County</strong> have contributed to<br />
increased traffic on local freeways. A comparison of congestion at major street intersections<br />
in unincorporated <strong>County</strong> areas with the countywide condition is shown below.<br />
For the majority of the intersections, increasing the capacity would require the construction<br />
of additional traffic lanes. Typically, these improvements are difficult because of funding<br />
constraints and the lack of land adjacent to roadways to build additional traffic lanes.<br />
However, capacity enhancing projects are proposed for three of the congested<br />
intersections. All of the projects are scheduled to be completed in 2008. DPW may also<br />
pursue funding for additional capacity enhancing projects through the recently passed<br />
infrastructure bond initiatives.<br />
Percent of Major Street Intersections Congestion<br />
(LOS E/F) in the AM Peak Hour<br />
Percent<br />
60<br />
50<br />
40<br />
30<br />
20<br />
10<br />
0<br />
38%<br />
29%<br />
1992<br />
37% 36%<br />
1993<br />
28%<br />
1995<br />
13%<br />
32%<br />
1997<br />
13%<br />
38%<br />
1999<br />
<strong>County</strong>wide Unincorporated <strong>County</strong><br />
13%<br />
Percent of Major Street Intersections Congestion<br />
(LOS E/F) in the PM Peak Hour<br />
Percent<br />
60<br />
53%<br />
50<br />
40<br />
43%<br />
30<br />
20<br />
10<br />
0<br />
1992<br />
50%<br />
1993<br />
29%<br />
47%<br />
1995<br />
20%<br />
40%<br />
1997<br />
20%<br />
1999<br />
<strong>County</strong>wide Unincorporated <strong>County</strong><br />
Supporting a Healthy Environment<br />
47%<br />
20%<br />
38%<br />
2001<br />
55%<br />
13%<br />
2001<br />
20%<br />
42%<br />
Zoning Enforcement: Neighborhood Enhancement Team (NET)<br />
2003<br />
52%<br />
2003<br />
31%<br />
13% 14%<br />
38%<br />
2005<br />
43% 43%<br />
Indicator of <strong>County</strong> Performance: Impact of the NET in the unincorporated areas of<br />
Florence-Firestone and Walnut Park<br />
90% Percentage of NET cases brought into compliance within six months in 2005-06<br />
667 Number of NET cases completed<br />
2005<br />
<strong>County</strong> Progress <strong>Report</strong><br />
113