

3.5 Space Curves in Matlab
3.5 Space Curves in Matlab
3.5 Space Curves in Matlab

Create successful ePaper yourself
Turn your PDF publications into a flip-book with our unique Google optimized e-Paper software.
248 Chapter 3 Plott<strong>in</strong>g <strong>in</strong> <strong>Matlab</strong><br />
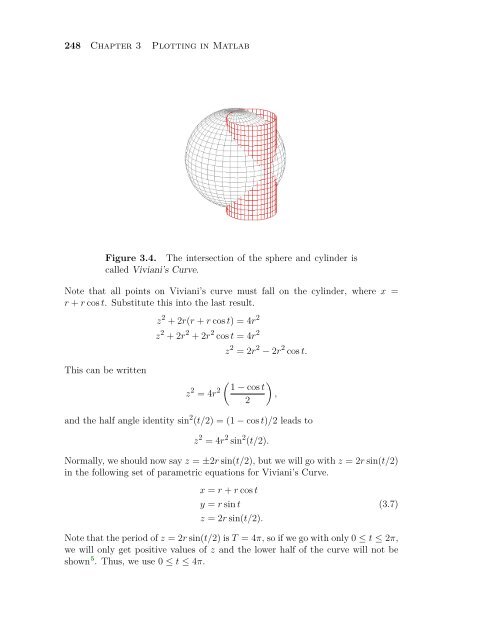
Figure 3.4. The <strong>in</strong>tersection of the sphere and cyl<strong>in</strong>der is<br />
called Viviani’s Curve.<br />
Note that all po<strong>in</strong>ts on Viviani’s curve must fall on the cyl<strong>in</strong>der, where x =<br />
r + r cos t. Substitute this <strong>in</strong>to the last result.<br />
This can be written<br />
z 2 + 2r(r + r cos t) = 4r 2<br />
z 2 + 2r 2 + 2r 2 cos t = 4r 2<br />
z 2 = 4r 2<br />
z 2 = 2r 2 − 2r 2 cos t.<br />
1 − cos t<br />
2<br />
<br />
,<br />
and the half angle identity s<strong>in</strong> 2 (t/2) = (1 − cos t)/2 leads to<br />
z 2 = 4r 2 s<strong>in</strong> 2 (t/2).<br />
Normally, we should now say z = ±2r s<strong>in</strong>(t/2), but we will go with z = 2r s<strong>in</strong>(t/2)<br />
<strong>in</strong> the follow<strong>in</strong>g set of parametric equations for Viviani’s Curve.<br />
x = r + r cos t<br />
y = r s<strong>in</strong> t<br />
z = 2r s<strong>in</strong>(t/2).<br />
(3.7)<br />
Note that the period of z = 2r s<strong>in</strong>(t/2) is T = 4π, so if we go with only 0 ≤ t ≤ 2π,<br />
we will only get positive values of z and the lower half of the curve will not be<br />
shown 5 . Thus, we use 0 ≤ t ≤ 4π.


