

3.5 Space Curves in Matlab
3.5 Space Curves in Matlab
3.5 Space Curves in Matlab

You also want an ePaper? Increase the reach of your titles
YUMPU automatically turns print PDFs into web optimized ePapers that Google loves.
256 Chapter 3 Plott<strong>in</strong>g <strong>in</strong> <strong>Matlab</strong><br />
compute x, y, and z.<br />
x=r.*cos(theta);<br />
y=r.*s<strong>in</strong>(theta);<br />
z=r;<br />
Draw the right circular cone <strong>in</strong> a<br />
shade of gray.<br />
mhndl=mesh(x,y,z)<br />
set(mhndl,...<br />
’EdgeColor’,[.6,.6,.6])<br />
Hold the surface plot and draw<br />
the plane z = y + 0.25.<br />
hold on<br />
[[x,y]=meshgrid(-1:0.1:1);<br />
z=y+0.25;<br />
phndl=mesh(x,y,z);<br />
set(phndl,...<br />
’EdgeColor’,[0.625,0,0])<br />
Adjust orientation.<br />
axis equal<br />
view(77,50)<br />
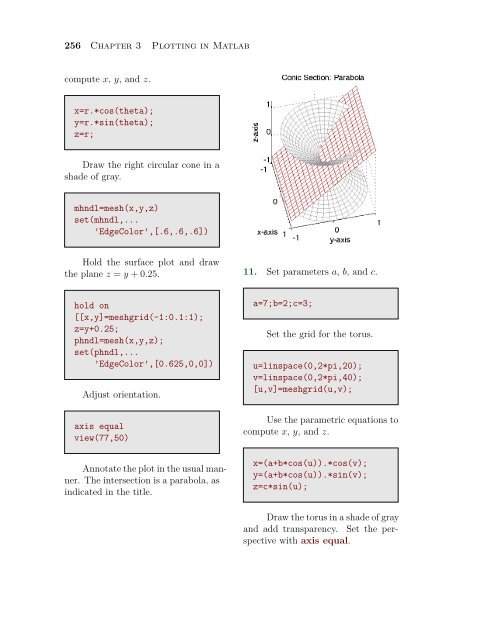
Annotate the plot <strong>in</strong> the usual manner.<br />
The <strong>in</strong>tersection is a parabola, as<br />
<strong>in</strong>dicated <strong>in</strong> the title.<br />
11. Set parameters a, b, and c.<br />
a=7;b=2;c=3;<br />
Set the grid for the torus.<br />
u=l<strong>in</strong>space(0,2*pi,20);<br />
v=l<strong>in</strong>space(0,2*pi,40);<br />
[u,v]=meshgrid(u,v);<br />
Use the parametric equations to<br />
compute x, y, and z.<br />
x=(a+b*cos(u)).*cos(v);<br />
y=(a+b*cos(u)).*s<strong>in</strong>(v);<br />
z=c*s<strong>in</strong>(u);<br />
Draw the torus <strong>in</strong> a shade of gray<br />
and add transparency. Set the perspective<br />
with axis equal.


