

3.5 Space Curves in Matlab
3.5 Space Curves in Matlab
3.5 Space Curves in Matlab

You also want an ePaper? Increase the reach of your titles
YUMPU automatically turns print PDFs into web optimized ePapers that Google loves.
258 Chapter 3 Plott<strong>in</strong>g <strong>in</strong> <strong>Matlab</strong><br />
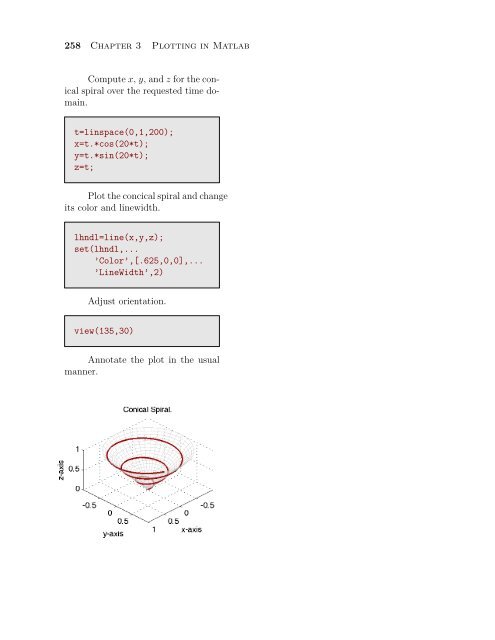
Compute x, y, and z for the conical<br />
spiral over the requested time doma<strong>in</strong>.<br />
t=l<strong>in</strong>space(0,1,200);<br />
x=t.*cos(20*t);<br />
y=t.*s<strong>in</strong>(20*t);<br />
z=t;<br />
Plot the concical spiral and change<br />
its color and l<strong>in</strong>ewidth.<br />
lhndl=l<strong>in</strong>e(x,y,z);<br />
set(lhndl,...<br />
’Color’,[.625,0,0],...<br />
’L<strong>in</strong>eWidth’,2)<br />
Adjust orientation.<br />
view(135,30)<br />
Annotate the plot <strong>in</strong> the usual<br />
manner.


