Gallium Arsenide (GaAs) - Courses
Gallium Arsenide (GaAs) - Courses
Gallium Arsenide (GaAs) - Courses

You also want an ePaper? Increase the reach of your titles
YUMPU automatically turns print PDFs into web optimized ePapers that Google loves.
446 A. Borghesi and G. Guizzetti<br />
in concentrated bromine. In the other cases no description of the surface<br />
treatment was given.<br />
The R values in the infrared from various labs agree to within the experimental<br />
uncertainty. It was determined that differences in the free-carrier concentration<br />
had no effect on R. The n values for A :::::: 50 Jim from Parsons and<br />
Coleman [3] and Abagyan et al. [4] present a difference of 0.28% at A =<br />
50 Jim, which lowers to 0.2% at A = 1000 Jim. In Abagyan et al. [4] the error<br />
fln in n, resulting from the measurement of the sample thickness and of wavelength<br />
A, is quoted not exceeding 0.005, while in Parsons and Coleman [3] n<br />
is quoted with four decimal places and its values are those reported in Table<br />
IV for 50 Jim S; A S; 400 Jim.<br />
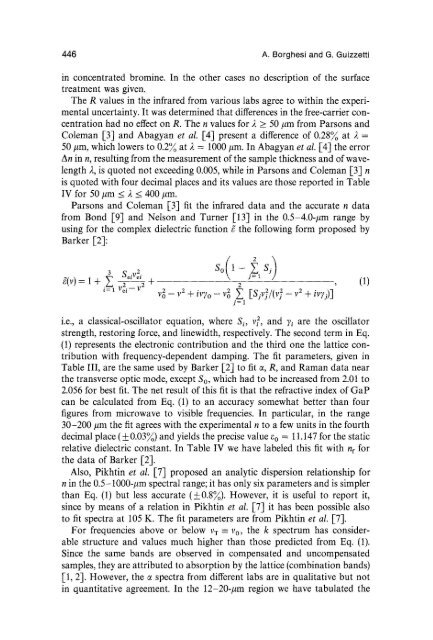
Parsons and Coleman [3] fit the infrared data and the accurate n data<br />
from Bond [9] and Nelson and Turner [13] in the 0.5-4.0-Jim range by<br />
using for the complex dielectric function g the following form proposed by<br />
Barker [2]:<br />
i.e., a classical-oscillator equation, where Si' vf, and Yi are the osciIIator<br />
strength, restoring force, and linewidth, respectively. The second term in Eq.<br />
(1) represents the electronic contribution and the third one the lattice contribution<br />
with frequency-dependent damping. The fit parameters, given in<br />
Table III, are the same used by Barker [2] to fit IX, R, and Raman data near<br />
the transverse optic mode, except So, which had to be increased from 2.01 to<br />
2.056 for best fit. The net result of this fit is that the refractive index of GaP<br />
can be calculated from Eq. (1) to an accuracy somewhat better than four<br />
figures from microwave to visible frequencies. In particular, in the range<br />
30-200 Jim the fit agrees with the experimental n to a few units in the fourth<br />
decimal place (±0.03%) and yields the precise value eo = 11.147 for the static<br />
relative dielectric constant. In Table IV we have labeled this fit with nf for<br />
the data of Barker [2].<br />
Also, Pikhtin et al. [7] proposed an analytic dispersion relationship for<br />
n in the 0.5-1000-Jim spectral range; it has only six parameters and is simpler<br />
than Eq. (1) but less accurate (±0.8%). However, it is useful to report it,<br />
since by means of a relation in Pikhtin et al. [7] it has been possible also<br />
to fit spectra at 105 K. The fit parameters are from Pikhtin et al. [7].<br />
For frequencies above or below V T == vo, the k spectrum has considerable<br />
structure and values much higher than those predicted from Eq. (1).<br />
Since the same bands are observed in compensated and uncompensated<br />
samples, they are attributed to absorption by the lattice (combination bands)<br />
[1, 2]. However, the IX spectra from different labs are in qualitative but not<br />
in quantitative agreement. In the 12-20-Jim region we have tabulated the