Journal of Cell and Molecular Biology - ResearchGate
Journal of Cell and Molecular Biology - ResearchGate
Journal of Cell and Molecular Biology - ResearchGate

You also want an ePaper? Increase the reach of your titles
YUMPU automatically turns print PDFs into web optimized ePapers that Google loves.
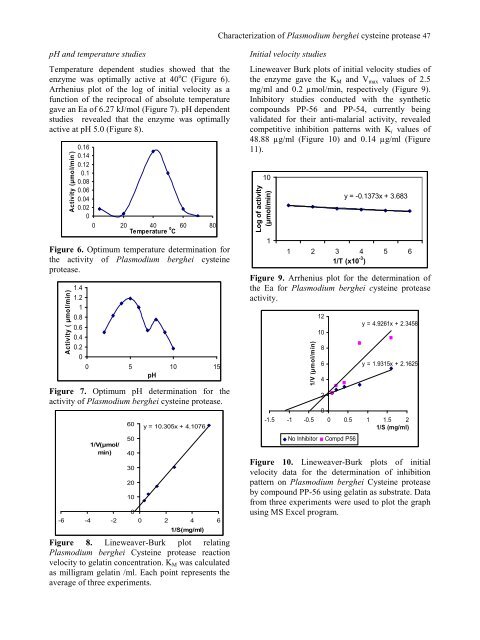
pH <strong>and</strong> temperature studies<br />
Temperature dependent studies showed that the<br />
enzyme was optimally active at 40 o C (Figure 6).<br />
Arrhenius plot <strong>of</strong> the log <strong>of</strong> initial velocity as a<br />
function <strong>of</strong> the reciprocal <strong>of</strong> absolute temperature<br />
gave an Ea <strong>of</strong> 6.27 kJ/mol (Figure 7). pH dependent<br />
studies revealed that the enzyme was optimally<br />
active at pH 5.0 (Figure 8).<br />
Activity (µmol/min - )<br />
0.16<br />
0.14<br />
0.12<br />
0.1<br />
0.08<br />
0.06<br />
0.04<br />
0.02<br />
0<br />
0 20 40 60 80<br />
Temperature 0 C<br />
Figure 6. Optimum temperature determination for<br />
the activity <strong>of</strong> Plasmodium berghei cysteine<br />
protease.<br />
Activity ( µmol/min)<br />
1.4<br />
1.2<br />
1<br />
0.8<br />
0.6<br />
0.4<br />
0.2<br />
0<br />
0 5 10 15<br />
pH<br />
Figure 7. Optimum pH determination for the<br />
activity <strong>of</strong> Plasmodium berghei cysteine protease.<br />
1/V(µmol/<br />
min)<br />
60<br />
50<br />
40<br />
30<br />
20<br />
10<br />
y = 10.305x + 4.1076<br />
0<br />
-6 -4 -2 0 2 4<br />
1/S(mg/ml)<br />
6<br />
Figure 8. Lineweaver-Burk plot relating<br />
Plasmodium berghei Cysteine protease reaction<br />
velocity to gelatin concentration. KM was calculated<br />
as milligram gelatin /ml. Each point represents the<br />
average <strong>of</strong> three experiments.<br />
Characterization <strong>of</strong> Plasmodium berghei cysteine protease 47<br />
Initial velocity studies<br />
Lineweaver Burk plots <strong>of</strong> initial velocity studies <strong>of</strong><br />
the enzyme gave the KM <strong>and</strong> Vmax values <strong>of</strong> 2.5<br />
mg/ml <strong>and</strong> 0.2 µmol/min, respectively (Figure 9).<br />
Inhibitory studies conducted with the synthetic<br />
compounds PP-56 <strong>and</strong> PP-54, currently being<br />
validated for their anti-malarial activity, revealed<br />
competitive inhibition patterns with Ki values <strong>of</strong><br />
48.88 µg/ml (Figure 10) <strong>and</strong> 0.14 µg/ml (Figure<br />
11).<br />
10<br />
Log <strong>of</strong> activity<br />
(µmol/min)<br />
1<br />
y = -0.1373x + 3.683<br />
1 2 3 4 5 6<br />
1/T (x10 -3 )<br />
Figure 9. Arrhenius plot for the determination <strong>of</strong><br />
the Ea for Plasmodium berghei cysteine protease<br />
activity.<br />
1/V (µmol/min)<br />
12<br />
10<br />
8<br />
6<br />
4<br />
2<br />
y = 4.9261x + 2.3458<br />
y = 1.9315x + 2.1625<br />
0<br />
-1.5 -1 -0.5 0 0.5 1 1.5 2<br />
1/S (mg/ml)<br />
No Inhibitor Compd P56<br />
Figure 10. Lineweaver-Burk plots <strong>of</strong> initial<br />
velocity data for the determination <strong>of</strong> inhibition<br />
pattern on Plasmodium berghei Cysteine protease<br />
by compound PP-56 using gelatin as substrate. Data<br />
from three experiments were used to plot the graph<br />
using MS Excel program.