

AMMJ - Library
AMMJ - Library
AMMJ - Library

Create successful ePaper yourself
Turn your PDF publications into a flip-book with our unique Google optimized e-Paper software.
<strong>AMMJ</strong> Strategic Maintenance Reporting 19<br />
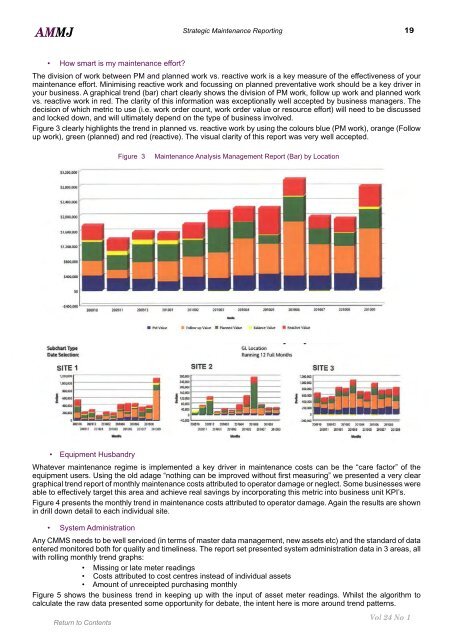
• How smart is my maintenance effort?<br />
The division of work between PM and planned work vs. reactive work is a key measure of the effectiveness of your<br />
maintenance effort. Minimising reactive work and focussing on planned preventative work should be a key driver in<br />
your business. A graphical trend (bar) chart clearly shows the division of PM work, follow up work and planned work<br />
vs. reactive work in red. The clarity of this information was exceptionally well accepted by business managers. The<br />
decision of which metric to use (i.e. work order count, work order value or resource effort) will need to be discussed<br />
and locked down, and will ultimately depend on the type of business involved.<br />
Figure 3 clearly highlights the trend in planned vs. reactive work by using the colours blue (PM work), orange (Follow<br />
up work), green (planned) and red (reactive). The visual clarity of this report was very well accepted.<br />
• Equipment Husbandry<br />
Whatever maintenance regime is implemented a key driver in maintenance costs can be the “care factor” of the<br />
equipment users. Using the old adage “nothing can be improved without first measuring” we presented a very clear<br />
graphical trend report of monthly maintenance costs attributed to operator damage or neglect. Some businesses were<br />
able to effectively target this area and achieve real savings by incorporating this metric into business unit KPI’s.<br />
Figure 4 presents the monthly trend in maintenance costs attributed to operator damage. Again the results are shown<br />
in drill down detail to each individual site.<br />
• System Administration<br />
Figure 3 Maintenance Analysis Management Report (Bar) by Location<br />
Any CMMS needs to be well serviced (in terms of master data management, new assets etc) and the standard of data<br />
entered monitored both for quality and timeliness. The report set presented system administration data in 3 areas, all<br />
with rolling monthly trend graphs:<br />
• Missing or late meter readings<br />
• Costs attributed to cost centres instead of individual assets<br />
• Amount of unreceipted purchasing monthly<br />
Figure 5 shows the business trend in keeping up with the input of asset meter readings. Whilst the algorithm to<br />
calculate the raw data presented some opportunity for debate, the intent here is more around trend patterns.<br />
Vol 24 No 1


