

AMMJ - Library
AMMJ - Library
AMMJ - Library

Create successful ePaper yourself
Turn your PDF publications into a flip-book with our unique Google optimized e-Paper software.
<strong>AMMJ</strong><br />
strategies that accomplish this are able to achieve a step change in performance and achieve incredible cost savings.<br />
Maintenance strategies that do not attempt to address the root cause of defects will continue to see lackluster<br />
results and struggle with financial performance.<br />
A Maintenance Strategy involves all elements that aim the prescriptive plan toward a common goal. Key parts of a<br />
maintenance strategy include Preventive and Predictive Maintenance based on a solid Failure Mode Elimination<br />
Strategy, Maintenance Planning consisting of repeatable procedures, work scheduled based on equipment criticality,<br />
work executed using precision techniques, proper commissioning of equipment when a new part or equipment is<br />
installed, and quality control using Predictive Maintenance Technologies to ensure no defects are present after<br />
this event occurs. The very last part of your maintenance strategy is FRACAS, because it drives the continuous<br />
improvement portion of this strategy.<br />
Failure Reporting<br />
What’s The FRACAS<br />
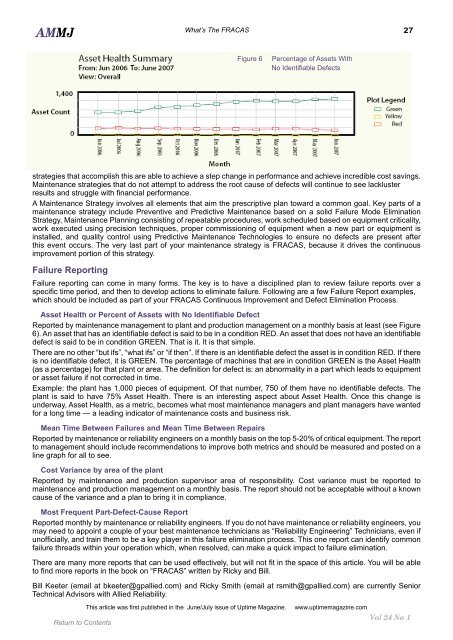
Figure 6 Percentage of Assets With<br />
No Identifiable Defects<br />
Failure reporting can come in many forms. The key is to have a disciplined plan to review failure reports over a<br />
specific time period, and then to develop actions to eliminate failure. Following are a few Failure Report examples,<br />
which should be included as part of your FRACAS Continuous Improvement and Defect Elimination Process.<br />
Asset Health or Percent of Assets with No Identifiable Defect<br />
Reported by maintenance management to plant and production management on a monthly basis at least (see Figure<br />
6). An asset that has an identifiable defect is said to be in a condition RED. An asset that does not have an identifiable<br />
defect is said to be in condition GREEN. That is it. It is that simple.<br />
There are no other “but ifs”, “what ifs” or “if then”. If there is an identifiable defect the asset is in condition RED. If there<br />
is no identifiable defect, it is GREEN. The percentage of machines that are in condition GREEN is the Asset Health<br />
(as a percentage) for that plant or area. The definition for defect is: an abnormality in a part which leads to equipment<br />
or asset failure if not corrected in time.<br />
Example: the plant has 1,000 pieces of equipment. Of that number, 750 of them have no identifiable defects. The<br />
plant is said to have 75% Asset Health. There is an interesting aspect about Asset Health. Once this change is<br />
underway, Asset Health, as a metric, becomes what most maintenance managers and plant managers have wanted<br />
for a long time — a leading indicator of maintenance costs and business risk.<br />
Mean Time Between Failures and Mean Time Between Repairs<br />
Reported by maintenance or reliability engineers on a monthly basis on the top 5-20% of critical equipment. The report<br />
to management should include recommendations to improve both metrics and should be measured and posted on a<br />
line graph for all to see.<br />
Cost Variance by area of the plant<br />
Reported by maintenance and production supervisor area of responsibility. Cost variance must be reported to<br />
maintenance and production management on a monthly basis. The report should not be acceptable without a known<br />
cause of the variance and a plan to bring it in compliance.<br />
Most Frequent Part-Defect-Cause Report<br />
Reported monthly by maintenance or reliability engineers. If you do not have maintenance or reliability engineers, you<br />
may need to appoint a couple of your best maintenance technicians as “Reliability Engineering” Technicians, even if<br />
unofficially, and train them to be a key player in this failure elimination process. This one report can identify common<br />
failure threads within your operation which, when resolved, can make a quick impact to failure elimination.<br />
There are many more reports that can be used effectively, but will not fit in the space of this article. You will be able<br />
to find more reports in the book on “FRACAS” written by Ricky and Bill.<br />
Bill Keeter (email at bkeeter@gpallied.com) and Ricky Smith (email at rsmith@gpallied.com) are currently Senior<br />
Technical Advisors with Allied Reliability.<br />
This article was first published in the June/July issue of Uptime Magazine. www.uptimemagazine.com<br />
Vol 24 No 1<br />
27


