Western Australian Museum Annual Report 2003-2004
Western Australian Museum Annual Report 2003-2004
Western Australian Museum Annual Report 2003-2004

You also want an ePaper? Increase the reach of your titles
YUMPU automatically turns print PDFs into web optimized ePapers that Google loves.
109<br />
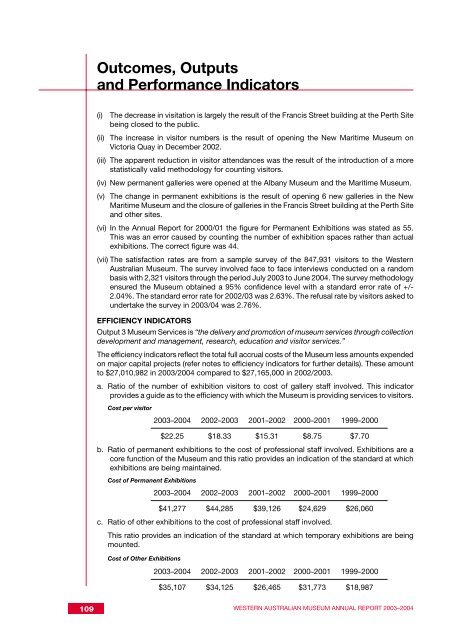
Outcomes, Outputs<br />
and Performance Indicators<br />
(i) The decrease in visitation is largely the result of the Francis Street building at the Perth Site<br />
being closed to the public.<br />
(ii) The increase in visitor numbers is the result of opening the New Maritime <strong>Museum</strong> on<br />
Victoria Quay in December 2002.<br />
(iii) The apparent reduction in visitor attendances was the result of the introduction of a more<br />
statistically valid methodology for counting visitors.<br />
(iv) New permanent galleries were opened at the Albany <strong>Museum</strong> and the Maritime <strong>Museum</strong>.<br />
(v) The change in permanent exhibitions is the result of opening 6 new galleries in the New<br />
Maritime <strong>Museum</strong> and the closure of galleries in the Francis Street building at the Perth Site<br />
and other sites.<br />
(vi) In the <strong>Annual</strong> <strong>Report</strong> for 2000/01 the figure for Permanent Exhibitions was stated as 55.<br />
This was an error caused by counting the number of exhibition spaces rather than actual<br />
exhibitions. The correct figure was 44.<br />
(vii) The satisfaction rates are from a sample survey of the 847,931 visitors to the <strong>Western</strong><br />
<strong>Australian</strong> <strong>Museum</strong>. The survey involved face to face interviews conducted on a random<br />
basis with 2,321 visitors through the period July <strong>2003</strong> to June <strong>2004</strong>. The survey methodology<br />
ensured the <strong>Museum</strong> obtained a 95% confidence level with a standard error rate of +/-<br />
2.04%. The standard error rate for 2002/03 was 2.63%. The refusal rate by visitors asked to<br />
undertake the survey in <strong>2003</strong>/04 was 2.76%.<br />
EFFICIENCY INDICATORS<br />
Output 3 <strong>Museum</strong> Services is “the delivery and promotion of museum services through collection<br />
development and management, research, education and visitor services.”<br />
The efficiency indicators reflect the total full accrual costs of the <strong>Museum</strong> less amounts expended<br />
on major capital projects (refer notes to efficiency indicators for further details). These amount<br />
to $27,010,982 in <strong>2003</strong>/<strong>2004</strong> compared to $27,165,000 in 2002/<strong>2003</strong>.<br />
a. Ratio of the number of exhibition visitors to cost of gallery staff involved. This indicator<br />
provides a guide as to the efficiency with which the <strong>Museum</strong> is providing services to visitors.<br />
Cost per visitor<br />
<strong>2003</strong>–<strong>2004</strong> 2002–<strong>2003</strong> 2001–2002 2000–2001 1999–2000<br />
$22.25 $18.33 $15.31 $8.75 $7.70<br />
b. Ratio of permanent exhibitions to the cost of professional staff involved. Exhibitions are a<br />
core function of the <strong>Museum</strong> and this ratio provides an indication of the standard at which<br />
exhibitions are being maintained.<br />
Cost of Permanent Exhibitions<br />
<strong>2003</strong>–<strong>2004</strong> 2002–<strong>2003</strong> 2001–2002 2000–2001 1999–2000<br />
$41,277 $44,285 $39,126 $24,629 $26,060<br />
c. Ratio of other exhibitions to the cost of professional staff involved.<br />
This ratio provides an indication of the standard at which temporary exhibitions are being<br />
mounted.<br />
Cost of Other Exhibitions<br />
<strong>2003</strong>–<strong>2004</strong> 2002–<strong>2003</strong> 2001–2002 2000–2001 1999–2000<br />
$35,107 $34,125 $26,465 $31,773 $18,987<br />
WESTERN AUSTRALIAN MUSEUM ANNUAL REPORT <strong>2003</strong>–<strong>2004</strong>