Profiling Nios II Systems Application Note 391 - Altera
Profiling Nios II Systems Application Note 391 - Altera
Profiling Nios II Systems Application Note 391 - Altera

Create successful ePaper yourself
Turn your PDF publications into a flip-book with our unique Google optimized e-Paper software.
AN-<strong>391</strong>-3.0 <strong>Application</strong> <strong>Note</strong><br />
Requirements<br />
101 Innovation Drive<br />
San Jose, CA 95134<br />
www.altera.com<br />
July 2011 <strong>Altera</strong> Corporation<br />
<strong>Profiling</strong> <strong>Nios</strong> <strong>II</strong> <strong>Systems</strong><br />
This application note describes the methods to measure the performance of a <strong>Nios</strong> ® <strong>II</strong><br />
system with the GNU profiler (nios2-elf-gprof), the performance counter component,<br />
and the timestamp interval timer component. This application note also includes two<br />
tutorials to measure performance in the <strong>Altera</strong> ® <strong>Nios</strong> <strong>II</strong> Software Build Tools (SBT)<br />
development flow.<br />
You must be familiar with the <strong>Nios</strong> <strong>II</strong> SBT development flow for <strong>Nios</strong> <strong>II</strong> systems,<br />
including the Quartus ® <strong>II</strong> software and Qsys to use the tutorials.<br />
Obtaining the Hardware Design<br />
The tutorials in this application note work with the <strong>Nios</strong> <strong>II</strong> Ethernet Standard Design<br />
Example.<br />
To use the design example, unzip the .zip for your development kit to a working<br />
directory on your system.<br />
1 This application note refers the software example directory as .<br />
Obtaining the Software Examples<br />
To obtain the software examples for this application note, follow these steps:<br />
1. Download the profiler_software_examples.zip.<br />
2. Unzip the profiler_software_examples.zip to in your system.<br />
1 This application note refers the directory as .<br />
© 2011 <strong>Altera</strong> Corporation. All rights reserved. ALTERA, ARRIA, CYCLONE, HARDCOPY, MAX, MEGACORE, NIOS,<br />
QUARTUS and STRATIX are Reg. U.S. Pat. & Tm. Off. and/or trademarks of <strong>Altera</strong> Corporation in the U.S. and other countries.<br />
All other trademarks and service marks are the property of their respective holders as described at<br />
www.altera.com/common/legal.html. <strong>Altera</strong> warrants performance of its semiconductor products to current specifications in<br />
accordance with <strong>Altera</strong>’s standard warranty, but reserves the right to make changes to any products and services at any time<br />
without notice. <strong>Altera</strong> assumes no responsibility or liability arising out of the application or use of any information, product, or<br />
service described herein except as expressly agreed to in writing by <strong>Altera</strong>. <strong>Altera</strong> customers are advised to obtain the latest<br />
version of device specifications before relying on any published information and before placing orders for products or services.<br />
Subscribe
Page 2 Tools<br />
Tools<br />
GNU Profiler<br />
You can use the GNU profiler without making any hardware changes to your <strong>Nios</strong> <strong>II</strong><br />
system. This tool directs the compiler to add calls to profiler library functions into<br />
your application code.<br />
The performance counter component and the timestamp component are minimally<br />
intrusive hardware methods for measuring the performance of a <strong>Nios</strong> <strong>II</strong> system. This<br />
application note describes and compares the two components. To use these methods,<br />
you add the hardware components to your system, and you add macro invocations to<br />
your source code to start and stop the components. The hardware components<br />
perform the measurements.<br />
Compiler speed optimizations affect functions to widely varying degrees. Compiler<br />
size optimizations also affect functions in different ways. These differences impact the<br />
cache usage and the resource contention, which can change the relative start times<br />
and therefore increase the execution times of functions. For these reasons, you must<br />
optimize your code with the -O3 compiler switch, and then perform profiling on the<br />
code to gain the most insight on how to improve an application in its final form.<br />
The tutorials use three tools to measure the performance of a <strong>Nios</strong> <strong>II</strong> system, as<br />
described in the following sections:<br />
■ GNU Profiler<br />
■ <strong>Altera</strong> Performance Counter<br />
■ High-Resolution Timer<br />
In addition, the program counter trace collection tool is available for some <strong>Nios</strong> <strong>II</strong><br />
processors. However, the tutorials do not use this tool.<br />
You use the GNU profiler to identify the areas of code that consume the most CPU<br />
time, and a performance counter or a timer component to analyze functional<br />
bottlenecks.<br />
You must make minimal changes to the source code to take measurements for analysis<br />
with the GNU profiler. To implement the required changes, follow these steps:<br />
1. In the <strong>Nios</strong> <strong>II</strong> SBT, enable the GNU profiler in your project by turning on the<br />
hal.enable_gprof and hal.enable_exit board support package (BSP)<br />
settings.<br />
1 If you use the <strong>Nios</strong> <strong>II</strong> SBT for Eclipse, the software enables<br />
hal.enable_exit by default.<br />
2. Verify that your main() function returns.<br />
1 When main() calls return() or terminates, alt_main() calls exit()<br />
as appropriate for profiling. The exit() function runs the BREAK 2<br />
instruction, which causes the profiling data to write to the gmon.out on the<br />
host computer.<br />
3. Rebuild the BSP and the application project.<br />
<strong>Profiling</strong> <strong>Nios</strong> <strong>II</strong> <strong>Systems</strong> July 2011 <strong>Altera</strong> Corporation
Tools Page 3<br />
<strong>Altera</strong> Performance Counter<br />
A performance counter is a block of counters in the hardware that measures the<br />
execution time of the code sections that you choose. A performance counter<br />
component can track up to seven code sections. By default, the component tracks<br />
three code sections. A pair of counters tracks each code section:<br />
■ Time—A 64-bit time (clock tick) counter that counts the number of clock ticks<br />
during code section runs.<br />
■ Occurrences—A 32-bit event counter that counts the number of times the code<br />
section runs.<br />
1 You can change the maximum number of measured code sections by editing the<br />
performance counter component in Qsys.<br />
These counters enable you to measure the execution time of the designated sections of<br />
C/C++ code. Macros enable you to mark the start and the end of the code sections in<br />
your program. The performance counter component has up to seven pairs of<br />
counters, supporting as many as seven measured sections of C/C++ code. You must<br />
add macros to your code at the start and end of each measured section. An additional,<br />
built-in pair of counters aggregates the individual code section counters, enabling you<br />
to measure each section as a fraction of a larger program.<br />
You can use performance counters for analyzing determinism and other runtime<br />
issues.<br />
1 The performance counter component occupies a substantial number of logic elements<br />
(LEs) on your device, and requires software implementation to obtain performance<br />
measurements.<br />
High-Resolution Timer<br />
A high-resolution timer, in contrast to a performance counter component, does not<br />
use a large number of LEs on your device, and does not require heavy<br />
implementation of every function call in your code to obtain performance<br />
measurements. Timers require explicit read calls in the sections of the source code that<br />
you want to measure, so their use is better suited for pinpointing the performance<br />
issues in a program. You must implement the source code manually; however,<br />
because this implementation is less pervasive, therefore, this implementation is also<br />
less intrusive. Unlike the performance counter macros, the timer requires many more<br />
processor cycles to make two function calls; one to read the time at the beginning of a<br />
measured section, and one to read the time at the end.<br />
July 2011 <strong>Altera</strong> Corporation <strong>Profiling</strong> <strong>Nios</strong> <strong>II</strong> <strong>Systems</strong>
Page 4 Using the GNU Profiler to Measure Code Performance<br />
Program Counter Trace Information<br />
The <strong>Nios</strong> <strong>II</strong> processor can generate complete and accurate program counter trace<br />
information. However, the GNU profiler does not use this information. To generate<br />
this information, you must have a <strong>Nios</strong> <strong>II</strong> processor configured with a JTAG debug<br />
module of level 3 or greater. The level 3 JTAG debug module creates on-chip trace<br />
data. You can capture approximately a dozen instructions in the on-chip trace buffer.<br />
You can obtain a much larger trace by configuring a <strong>Nios</strong> <strong>II</strong> core with a level 4 JTAG<br />
debug module to generate off-chip trace information; however, you need a First<br />
Silicon Solutions, Inc. (FS2) or Lauterbach Datentechnik GmBH (Lauterbach)<br />
(www.lauterbach.com) hardware to collect this off-chip trace data.<br />
f For more information about the Lauterbach hardware, refer to “Debuggers” in the<br />
Debugging <strong>Nios</strong> <strong>II</strong> Designs chapter of the Embedded Design Handbook.<br />
Using the GNU Profiler to Measure Code Performance<br />
The following sections explain the advantages and limitations of using the GNU<br />
profiler for performance analysis. A tutorial demonstrates the use of the GNU profiler<br />
to collect and analyze performance data.<br />
GNU Profiler Advantages<br />
The major advantage to measuring performance with the GNU profiler is that the<br />
GNU profiler provides an overview of the entire system. Although the GNU profiler<br />
adds some overhead, the GNU profiler distributes this overhead throughout the<br />
system evenly. The functions the GNU profiler identifies as consuming the most<br />
processor time also consume the most processor time when you run the application at<br />
full speed without profiler implementation.<br />
GNU Profiler Limitations<br />
Adding instructions to each function call for use by the GNU profiler affects the<br />
behavior of the code in the following ways:<br />
■ Each function is slightly larger due to the additional function call to collect<br />
profiling information.<br />
■ The entry and the exit time of each function due to profiling information<br />
collection.<br />
■ The instruction-cache misses are higher because the profiling function is in the<br />
instruction cache memory.<br />
■ Memory that records the profiling data can change the behavior of the data cache.<br />
These effects can mask the time sensitive issues that you are trying to uncover<br />
through profiling.<br />
The GNU profiler determines the percentage of time spent in each function by<br />
interpolation, based on periodic samplings of the program counter. The GNU profiler<br />
ties the periodic samples to the timer tick of the system clock. The GNU profiler can<br />
take samples only when you enable interrupts, and therefore cannot record the<br />
processor cycles spent in interrupt routines.<br />
<strong>Profiling</strong> <strong>Nios</strong> <strong>II</strong> <strong>Systems</strong> July 2011 <strong>Altera</strong> Corporation
Using the GNU Profiler to Measure Code Performance Page 5<br />
The GNU profiler cannot profile individual functions. You can use the GNU profiler<br />
to profile the entire system, or not at all.<br />
The profiling data is a sampling of the program counter at the resolution of the system<br />
timer tick. Therefore, the profiling data provides estimation, not an exact<br />
representation, of the processor time spent in different functions. You can improve the<br />
statistical significance of the sampling by increasing the frequency of the system timer<br />
tick. However, increasing the frequency of the tick increases the time spent recording<br />
samples, which in turn affects the integrity of the measurement.<br />
1 To use the GNU profiler successfully with your custom hardware design, you must<br />
ensure that your design includes a system clock timer. The GNU profiler requires this<br />
component to produce proper output.<br />
Software Considerations<br />
The GNU profiler implements your source code with functions to track processor<br />
usage.<br />
Profiler Mechanics<br />
You enable the GNU profiler by turning on the hal.enable_gprof switch in the<br />
scripts to generate the BSP. Turning on this switch automatically turns on the -pg<br />
compiler switch and then links the profiling library code in the altera_nios2<br />
software component with the BSP. This code counts the number of calls to each<br />
profiled function.<br />
The -pg compiler option forces the compiler to insert a call to the mcount() function<br />
(located in the file altera_nios2/HAL/src/alt_mcount.S) at the beginning of every<br />
function call. The calls to mcount() track every dynamic parent and child function<br />
call relationship to enable the construction of a call graph. The option also installs<br />
nios2_pcsample()function (located in the file altera_nios2/HAL/src/<br />
alt_gmon.c) that samples the foreground program counter at every system clock<br />
interrupt. When the program executes, the GNU profiler collects data on the host of<br />
the gmon.out. The nios2-elf-gprof utility can read this file and display profiling<br />
information about the program.<br />
The profiling code operates on the target by performing the following steps:<br />
1. The Compiler implements function prologues with a call to mcount() to enable<br />
the Compiler to determine the function call graph. The GNU profiler<br />
documentation refers to this data as the function call arc data.<br />
2. The timer interrupt handler registers an alarm to capture information about the<br />
foreground function (histogram data) that executes when the alarm triggers.<br />
3. The heap allocates a target memory to store the profiling data.<br />
4. When your code exits with a BREAK 2 instruction, the nios2-download utility<br />
copies the profiling data from the target to the host.<br />
1 The nios2-elf-gprof utility requires the function call arc data and the<br />
histogram data to work correctly.<br />
July 2011 <strong>Altera</strong> Corporation <strong>Profiling</strong> <strong>Nios</strong> <strong>II</strong> <strong>Systems</strong>
Page 6 Using the GNU Profiler to Measure Code Performance<br />
f For more information about the GNU profiler, refer to the <strong>Nios</strong> <strong>II</strong> GNU<br />
profiler documentation, included with the GCC documentation, available<br />
on the <strong>Nios</strong> <strong>II</strong> Embedded Design Suite Support page of the <strong>Altera</strong> website.<br />
Profiler Overhead<br />
Using the GNU profiler impacts memory and processor cycles.<br />
Memory<br />
The impact of the profiling information on the .text section size is proportional to<br />
the number of small functions in the application. The code overhead—the size of<br />
the .text section—increases when the GNU profiler enables profiling, due to the<br />
addition of the nios2_pcsample() and mcount() functions. The GNU profiler<br />
implements the system timer with a call to nios2_pcsample(), and implements<br />
every function with a call to mcount(). The .text section increases by the additional<br />
function calls and by the sizes of these two functions.<br />
1 To view the impact on the .text section, you can compare the sizes of the .text<br />
sections in the .objdump.<br />
The GNU profiler uses buckets to store data on the heap during profiling. Each bucket<br />
is two bytes in size. Each bucket holds samples for 32 bytes of code in the .text<br />
section. The total number of profiler buckets allocated from the heap is when you<br />
divide the size of the .text section by 32. The heap memory that the GNU profiler<br />
buckets consume is therefore:<br />
((.text section size) / 32) × 2 bytes<br />
The GNU profiler measures all functions in the object code that the GNU profiler<br />
compiles with profiling information. This set of functions includes the library<br />
functions, which include the run-time library and the BSP.<br />
Processor Cycles<br />
The GNU profiler tracks each individual function with a call to mcount(). Therefore,<br />
if the application code contains many small functions, the impact of the GNU profiler<br />
on processor time is larger. However, the resolution of the profiled data is higher. To<br />
calculate the additional processor time consumed by profiling with mcount(),<br />
multiply the amount of time that the processor requires to execute mcount() by the<br />
number of run-time function calls in your application run.<br />
On every clock tick, the processor calls the nios2_pcsample() function. To<br />
calculate the required additional processor time to perform profiling with<br />
nios2_pcsample(), multiply the time the processor requires to execute this<br />
function by the number of clock ticks that your application requires, which includes<br />
the time the mcount() calls and execution requires.<br />
To calculate the number of additional processor cycles used for profiling, add the<br />
overhead you calculated for all the calls to mcount() to the overhead you calculated<br />
for all the calls to nios2_pcsample().<br />
<strong>Profiling</strong> <strong>Nios</strong> <strong>II</strong> <strong>Systems</strong> July 2011 <strong>Altera</strong> Corporation
Using the GNU Profiler to Measure Code Performance Page 7<br />
Hardware Considerations<br />
The GNU profiler requires only a system timer. If your <strong>Nios</strong> <strong>II</strong> hardware design<br />
includes a system timer, you do not need to change your design.<br />
Tutorial: Using the GNU Profiler<br />
For demonstration purposes, this tutorial uses the <strong>Nios</strong> <strong>II</strong> Ethernet Standard design<br />
example for the <strong>Nios</strong> <strong>II</strong> Embedded Evaluation Kit, Cyclone <strong>II</strong>I Edition (NEEK)<br />
development kit. You could use other similar design examples which target your<br />
development kit.<br />
To configure your device with the design example, follow these steps:<br />
1. Start the Quartus <strong>II</strong> software, version 11.0 or later.<br />
2. On the File menu, click Open Project.<br />
3. Open niosii_ethernet_standard_3c25.qpf.<br />
4. On the Tools menu, click Programmer.<br />
5. Click Start to download the SRAM Object File (.sof) to your device.<br />
1 If the software disabled the Start button, or the Hardware Setup field does<br />
not list the USB-Blaster cable, refer to the Introduction to the Quartus <strong>II</strong><br />
Software manual for more details on the Programmer tool.<br />
Profiler Example with the <strong>Nios</strong> <strong>II</strong> Command Line<br />
Creating the Profiler Software Example<br />
To create the profiler_gnu software project in the <strong>Nios</strong> <strong>II</strong> command-line flow, follow<br />
these steps:<br />
1. Open a <strong>Nios</strong> <strong>II</strong> command shell by executing one of the following steps, depending<br />
on your environment:<br />
■ In the Windows operating system, on the Start menu, point to Programs ><br />
<strong>Altera</strong> > <strong>Nios</strong> <strong>II</strong> EDS , and click <strong>Nios</strong> <strong>II</strong> Command Shell.<br />
■ In the Linux operating system, in a command shell, change directories to<br />
, and type the command ./sdk_shell.<br />
2. Change to the directory /app/profiler_gnu<br />
3. Create and build the application with the create-this-app script, by typing the<br />
following command:<br />
./create-this-app r<br />
The create-this-app script runs the create-this-bsp script, which reads settings from<br />
the parameter_definition.tcl in /bsp/hal_profiler_gnu.<br />
This Tcl file contains the following lines:<br />
set_setting hal.enable_gprof true<br />
set_setting hal.enable_exit true<br />
The first setting enables the GNU profiler, and the second setting enables the<br />
alt_main() function to call exit() following main().<br />
July 2011 <strong>Altera</strong> Corporation <strong>Profiling</strong> <strong>Nios</strong> <strong>II</strong> <strong>Systems</strong>
Page 8 Using the GNU Profiler to Measure Code Performance<br />
Running the Profiler Software Example<br />
To run the application and collect the GNU profiler data, follow these steps:<br />
1. Open a second <strong>Nios</strong> <strong>II</strong> command shell.<br />
2. In the second shell, open a nios2-terminal session by typing the following<br />
command:<br />
nios2-terminal r<br />
3. In your original <strong>Nios</strong> <strong>II</strong> command shell, download the .elf to the development<br />
board, run your design, and write the GNU profiler data to the gmon.out, by<br />
typing the following command:<br />
nios2-download -g --write-gmon gmon.out *.elf r<br />
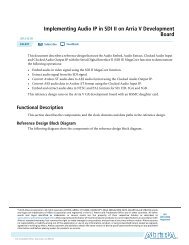
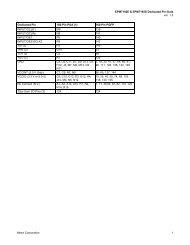
The GNU profiler collects data while the application runs, and then writes the data<br />
to the gmon.out when the application calls the exit() function. Figure 1 shows<br />
an example of the GNU profiler output in the <strong>Nios</strong> <strong>II</strong> command shell.<br />
4. Exit nios2-terminal by typing control-C.<br />
Figure 1. GNU Profiler Output on <strong>Nios</strong> <strong>II</strong> Command Shell<br />
Creating the GNU Profiler Report<br />
When you run your project, your project creates the gmon.out. You must format this<br />
file to a readable format. To format this file, follow these steps:<br />
1. In the original <strong>Nios</strong> <strong>II</strong> command shell, change your directory to<br />
/app/profiler_gnu.<br />
2. Type the following command:<br />
nios2-elf-gprof profiler_gnu.elf gmon.out > report.txt r<br />
This command generates a flat profile report and a call graph, which you can view<br />
in the report.txt.<br />
3. Use any text editor to view the report.txt.<br />
For more information about the GNU profiler report, refer to “Analyzing the GNU<br />
Profiler Report” on page 10 .<br />
<strong>Profiling</strong> <strong>Nios</strong> <strong>II</strong> <strong>Systems</strong> July 2011 <strong>Altera</strong> Corporation
Using the GNU Profiler to Measure Code Performance Page 9<br />
Profiler Example with <strong>Nios</strong> <strong>II</strong> SBT for Eclipse<br />
Creating and Running the Profiler Software Example<br />
1. Start the <strong>Nios</strong> <strong>II</strong> SBT for Eclipse.<br />
2. Under File menu, point to New, and click <strong>Nios</strong> <strong>II</strong> <strong>Application</strong> and BSP from<br />
template.<br />
3. Set SOPC Information File name by browsing to locate the SOPC Information File<br />
(.sopcinfo) in .<br />
4. Name your project, such as profiler_gnu.<br />
5. Under Templates, select Blank Project.<br />
6. Click Finish to create your new project.<br />
7. Locate the /eclipse_source_files/profiler_gnu folder<br />
and copy all the files in this directory. In <strong>Nios</strong> <strong>II</strong> SBT for Eclipse, right click on<br />
profiler_gnu in Project Explorer view and select Paste.<br />
8. Right click your project in the Project Explorer view, point to <strong>Nios</strong> <strong>II</strong> and click BSP<br />
Editor.<br />
9. In the <strong>Nios</strong> <strong>II</strong> BSP Editor, turn on hal.enable_gprof to enable the GNU profiler<br />
in your project.<br />
10. Generate your BSP project and exit.<br />
11. Right click your project in the Project Explorer view and then click Build Project.<br />
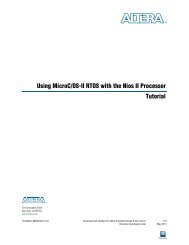
12. To download and run the profiler_gnu software, right click your project, point to<br />
Run As, and then click <strong>Nios</strong> <strong>II</strong> Hardware.<br />
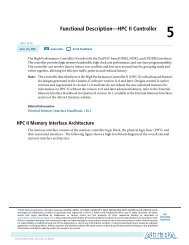
Figure 2 shows the output of the software to the <strong>Nios</strong> <strong>II</strong> console.<br />
Figure 2. <strong>Nios</strong> <strong>II</strong> Console After Running profiler_gnu<br />
Viewing the GNU Profiler Report<br />
The software creates the gmon.out in your project folder, which you can view in the<br />
Project Explorer view of the <strong>Nios</strong> <strong>II</strong> SBT for Eclipse. If the gmon.out does not appear,<br />
right click on your project and select Refresh. When you open gmon.out, the <strong>Nios</strong> <strong>II</strong><br />
SBT for Eclipse switches to the <strong>Profiling</strong> view, in which you can view the report. For<br />
more information about the GNU profiler report, refer to “Analyzing the GNU<br />
Profiler Report”.<br />
July 2011 <strong>Altera</strong> Corporation <strong>Profiling</strong> <strong>Nios</strong> <strong>II</strong> <strong>Systems</strong>
Page 10 Using the GNU Profiler to Measure Code Performance<br />
Analyzing the GNU Profiler Report<br />
The information in this section is applicable to the GNU profiler report that the<br />
command line or the <strong>Nios</strong> <strong>II</strong> SBT for Eclipse generates.<br />
The GNU profiler report contains information in the following formats:<br />
■ The flat profile portion of the report identifies the child functions in the order in<br />
which they consume processing time.<br />
■ The call graph portion of the report describes the call tree of the program sorted by<br />
the total amount of time spent in each function and its children. Each entry in this<br />
table consists of several lines. The line with the index number at the left hand<br />
margin lists the current function. The lines above it list the functions that called<br />
this function, and the lines below it list the functions this one called, with<br />
exceptions and conditions detailed further in the report itself and the GNU profiler<br />
documentation.<br />
f For more information, refer to the <strong>Nios</strong> <strong>II</strong> GNU profiler documentation,<br />
with the GCC documentation, available at the <strong>Nios</strong> <strong>II</strong> Embedded Design<br />
Suite Support page.<br />
Example 1 shows the GNU profiler report excerpts from the previous tutorial. In<br />
Example 1, the flat profile shows that the checksum_test_routine() function call<br />
consumed 79.19% of the processing time during the execution.<br />
The granularity statement in the call graph report states that the report covers 2.55<br />
seconds (2550 milliseconds). The <strong>Nios</strong> <strong>II</strong> timer (sys_clk_timer) has a 10 millisecond<br />
timer. The GNU profiler calls the timer interrupt once at the beginning, before a full<br />
clock period elapsed, and once every 10 milliseconds thereafter. A precise report,<br />
therefore, would show that the GNU profiler calls the timer interrupt handler 255<br />
times. Index[13] shows that the GNU profiler calls<br />
alt_avalon_timer_sc_irq()256 times, which is in the precision range of this<br />
measurement method.<br />
<strong>Profiling</strong> <strong>Nios</strong> <strong>II</strong> <strong>Systems</strong> July 2011 <strong>Altera</strong> Corporation
Using Performance Counter and Timer Components Page 11<br />
1 <strong>Note</strong> that the result you see may vary from Example 1.<br />
Example 1. Flat Profile and Call Graph Example<br />
Flat profile:<br />
Each sample counts as 0.01 seconds.<br />
% cumulative self self total<br />
time seconds seconds calls s/call s/call name<br />
79.19 2.02 2.02 1 2.02 2.03 checksum_test_routine<br />
18.01 2.48 0.46 1 0.46 0.46 alt_busy_sleep<br />
.<br />
.<br />
.<br />
Call graph (explanation follows)<br />
granularity: each sample hit covers 32 byte(s) for 0.39% of 2.55 seconds<br />
index % time self children called name<br />
0.00 0.00 273/273 alt_irq_entry [106]<br />
[13] 0.0 0.00 0.00 273 alt_irq_handler [13]<br />
0.00 0.00 256/256 alt_avalon_timer_sc_irq [14]<br />
0.00 0.00 17/17 altera_avalon_jtag_uart_irq [17]<br />
.<br />
.<br />
.<br />
Using Performance Counter and Timer Components<br />
After the GNU profiler identifies areas of code that consume the most processor time,<br />
a performance counter or a timer component can further analyze these functional<br />
bottlenecks.<br />
The following sections describe the advantages and limitations of using performance<br />
counters and timers for performance analysis. A tutorial demonstrates the use of<br />
performance counters and timers to collect and analyze performance data.<br />
Performance Counter Advantages<br />
Performance counters are the only mechanism available with the <strong>Nios</strong> <strong>II</strong> development<br />
kits that provide measurements with little intrusion. You can use efficient macros to<br />
start and stop the measurement for each measured section. A performance counter is<br />
an order of magnitude faster than the GNU profiler. The only less intrusive way to<br />
collect measurement data would be a completely hardware-based solution, such as a<br />
logic analyzer configured with triggers on particular bus addresses.<br />
July 2011 <strong>Altera</strong> Corporation <strong>Profiling</strong> <strong>Nios</strong> <strong>II</strong> <strong>Systems</strong>
Page 12 Using Performance Counter and Timer Components<br />
Timer Advantages<br />
Unlike the performance counter, which can track only seven sections of code<br />
simultaneously, the timer has no such limit. You can read the timer 1,000 times and<br />
store the timer in 1,000 different variables as a start time for a section. Then, you can<br />
compare the timer to 1,000 end timer readings. The only practical limiting factors are<br />
memory consumption, processor overhead, and complexity.<br />
Performance Counter and Timer Hardware Considerations<br />
One disadvantage to measuring performance with a performance counter is the size<br />
of the counter. The performance counter component consumes a large number of LEs<br />
on your device.<br />
On a 3C120 device, a single performance counter component with three section<br />
counters defined in a modified standard hardware design consumes 671 logic cells<br />
(LCs), and 420 LC registers. In the same design, a single performance counter defined<br />
with seven section counters consumes 1339 logic cells and 808 LC registers. The<br />
resource usage of the performance counter component is nearly identical on all<br />
devices.<br />
1 Remove the performance counter from the final version of your system to save<br />
resources.<br />
The timer consumes hardware resources, although substantially less than a<br />
performance counter. The timer also introduces an additional interrupt source in the<br />
system that impacts interrupt latency.<br />
1 Adding performance counters and timers can reduce f MAX.<br />
Performance Counter and Timer Software Considerations<br />
A common disadvantage of performance counters and timers is the lack of context<br />
awareness. If a timer interrupt occurs during the measurement of a section of code,<br />
performance counters and timers add the time taken by the processor to process the<br />
timer interrupt to the total measurement time. This effect occurs for simple interrupts<br />
and multithreading context switching, although this effect occurs more in a<br />
multithreaded system. Many threads or interrupt service routines might execute<br />
while you measure the section of code, resulting in a very large, skewed<br />
measurement. The resulting measurement distortion is unpredictable, and has no<br />
correlation with the behavior of the code section you are attempting to measure.<br />
To avoid context switch impacts, most multithreaded operating systems have a<br />
system call to temporarily lock the scheduler. Alternatively, you can disable interrupts<br />
to avoid context switches during section measurement.<br />
1 Disabling interrupts or locking the scheduler affects the behavior of your system, so<br />
you must use these techniques only as a last resort.<br />
<strong>Profiling</strong> <strong>Nios</strong> <strong>II</strong> <strong>Systems</strong> July 2011 <strong>Altera</strong> Corporation
Using Performance Counter and Timer Components Page 13<br />
Performance Counter Software Considerations<br />
You must use the PERF_BEGIN and PERF_END performance counter macros to record<br />
the beginning and ending times of each measured section.<br />
PERF_BEGIN and PERF_END are single writes to the performance counter<br />
component. These macros are very efficient, requiring only two or three machine<br />
instructions.<br />
Example 2 shows the PERF_BEGIN and PERF_END performance counter macros in<br />
altera_avalon_performance_counter.h:<br />
Example 2. PERF_BEGIN and PERF_END Performance Counter Macros in<br />
altera_avalon_performance_counter.h<br />
#define PERF_BEGIN(p,n) IOWR((p),(((n)*4)+1),0)<br />
#define PERF_END(p,n) IOWR((p),(((n)*4) ),0)<br />
The Global Counter<br />
The performance counter component contains several counters. You can configure the<br />
number of measured sections in Qsys. You have one pair of counters for each<br />
measured section, as described in “<strong>Altera</strong> Performance Counter” on page 3. In<br />
addition, the performance counter component always has a global counter.<br />
The global counter measures the total time of the measurement. When you stop the<br />
global counter, other counters do not run. The PERF_START_MEASURING and<br />
PERF_STOP_MEASURING macros control the global counter.<br />
w Do not attempt to manipulate the global counter in any other way.<br />
f For more information about performance counters, refer to the Performance Counter<br />
Core chapter in the Embedded Peripherals IP User Guide.<br />
Hardware Considerations<br />
Performance counters and timestamp interval timers are Qsys components. When<br />
you add one to an existing system, you must regenerate the Qsys system and<br />
recompile the .sof in the Quartus <strong>II</strong> software. Timers and performance counters can<br />
eventually overflow, such as any hardware counter.<br />
Tutorial: Using Performance Counters and Timers<br />
This tutorial demonstrates the use of performance counters and timestamp interval<br />
timers to measure the performance of a <strong>Nios</strong> <strong>II</strong> system more precisely than is possible<br />
with the GNU profiler, by identifying the sections of code that use the most processor<br />
time.<br />
This tutorial uses the same NEEK design as the GNU profiler tutorial. This design has<br />
an interval timer and a performance counter. You can change the timer interval and<br />
the number of sections that the performance counter measures.<br />
July 2011 <strong>Altera</strong> Corporation <strong>Profiling</strong> <strong>Nios</strong> <strong>II</strong> <strong>Systems</strong>
Page 14 Using Performance Counter and Timer Components<br />
Modifying the <strong>Nios</strong> <strong>II</strong> Hardware Design<br />
You must modify the <strong>Nios</strong> <strong>II</strong> Ethernet Standard design example for this tutorial. To<br />
modify the <strong>Nios</strong> <strong>II</strong> Ethernet Standard design example, follow these steps:<br />
1. In Quartus <strong>II</strong> software, on the Tools menu, click Qsys.<br />
2. In , click peripheral_system.qsys.<br />
3. Right click the high_res_timer module and then click Edit.<br />
4. Under Timeout period, set the interval time Period to 1 and the units to us<br />
(microseconds).<br />
5. Click Finish.<br />
6. On the File menu, click Save.<br />
7. The <strong>Nios</strong> <strong>II</strong> Ethernet Standard design example is a hierarchal based design. To<br />
generate the system, on the File menu, click Open, and then select<br />
eth_std_main_system.qsys.<br />
8. Click the Generation tab.<br />
9. Turn on the Create HDL design files for synthesis and Create block symbol file<br />
(.bsf) options.<br />
10. Ensure that the Output Directory path is<br />
/eth_std_main_system.<br />
11. Click Generate. Save the system if the software prompts you to do so.<br />
12. Exit Qsys when generation is complete.<br />
13. To generate the .sof, in the Quartus <strong>II</strong> software, on the Processing menu, click Start<br />
Compilation.<br />
14. Click OK when the following message appears:<br />
Full Compilation was successful<br />
Programming the Hardware Design to Your Device<br />
After compiling your modified hardware design, you can program the hardware<br />
design to your device. To do so, follow these steps:<br />
1. On the Tools menu, click Programmer.<br />
2. Click Start to download the .sof to your device.<br />
f If the software disables the Start button, or the Hardware Setup field does<br />
not list the USB-Blaster cable, refer to the Introduction to the Quartus <strong>II</strong><br />
Software manual for more details on the Programmer tool.<br />
<strong>Profiling</strong> <strong>Nios</strong> <strong>II</strong> <strong>Systems</strong> July 2011 <strong>Altera</strong> Corporation
Using Performance Counter and Timer Components Page 15<br />
Performance Counter Example with the <strong>Nios</strong> <strong>II</strong> Command Line<br />
This section describes how to create and run the performance counter software<br />
example with the <strong>Nios</strong> <strong>II</strong> command line.<br />
Creating the Performance Counter Software Example<br />
To create the profiler_performance_counter software project in the <strong>Nios</strong> <strong>II</strong> software<br />
build flow, follow these steps:<br />
1. Open a <strong>Nios</strong> <strong>II</strong> command shell as described in “Creating the Profiler Software<br />
Example” on page 7.<br />
2. Change to the /app/profiler_performance_counter<br />
directory.<br />
3. Create and build the application by typing the following command:<br />
./create-this-app r<br />
The create-this-app script runs the create-this-bsp script, which reads settings<br />
from the parameter_definition.tcl in<br />
/bsp/hal_profiler_performance_counter. This Tcl file<br />
contains the following lines:<br />
set_setting hal.sys_clk_timer peripheral_subsystem_sys_clk_timer<br />
set_setting hal.timestamp_timer peripheral_subsystem_high_res_timer<br />
set_setting hal.enable_gprof true<br />
set_setting hal.enable_exit true<br />
The first two lines set the system clock timer and timestamp timer to the<br />
corresponding timers in the Qsys system.<br />
The third line enables the GNU profiler, and the last line enable the alt_main()<br />
function to call exit() following main().<br />
Running the Performance Counter Software Example<br />
To run the application and collect the GNU profiler data, follow these steps:<br />
1. Open a second <strong>Nios</strong> <strong>II</strong> command shell.<br />
2. In the second shell, open a nios2-terminal session by typing the following<br />
command:<br />
nios2-terminal r<br />
3. In your original <strong>Nios</strong> <strong>II</strong> command shell, run the program by typing the following<br />
command:<br />
nios2-download -g *.elf r<br />
July 2011 <strong>Altera</strong> Corporation <strong>Profiling</strong> <strong>Nios</strong> <strong>II</strong> <strong>Systems</strong>
Page 16 Using Performance Counter and Timer Components<br />
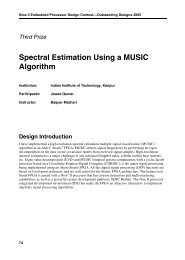
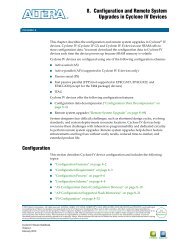
Figure 3 shows an example of the output that appears in the <strong>Nios</strong> <strong>II</strong> command shell.<br />
Your output might vary. For more information, refer to “Analyzing the Performance<br />
Counter Report”.<br />
Figure 3. Performance Counter Report on <strong>Nios</strong> <strong>II</strong> Command Shell<br />
Performance Counter Example with <strong>Nios</strong> <strong>II</strong> SBT for Eclipse<br />
This section describes how to create and run the profiler_performance_counter<br />
software example with the <strong>Nios</strong> <strong>II</strong> SBT for Eclipse.<br />
1. Start the <strong>Nios</strong> <strong>II</strong> SBT for Eclipse.<br />
2. Under File menu, point to New, and click <strong>Nios</strong> <strong>II</strong> <strong>Application</strong> and BSP from<br />
template.<br />
3. Set SOPC Information File name by browsing to the directory<br />
and selecting the .sopcinfo.<br />
4. Give your project a name, for example profiler_performance_counter.<br />
5. Under Templates, select Blank Project.<br />
6. Click Finish to create your new project.<br />
7. Locate the<br />
/eclipse_source_files/profiler_performance_counter<br />
folder, and copy all the files in this directory. In <strong>Nios</strong> <strong>II</strong> SBT for Eclipse, right click<br />
on profiler_gnu in Project Explorer view and select Paste.<br />
8. Right click your project in the Project Explorer view, point to <strong>Nios</strong> <strong>II</strong> and click BSP<br />
Editor.<br />
9. In the <strong>Nios</strong> <strong>II</strong> BSP Editor, turn on hal.enable_gprof to enable the GNU profiler<br />
in your project.<br />
10. Set the hal.sys_clk_timer to the peripheral_subsystem_sys_clk_timer<br />
component.<br />
11. Set hal.timestamp_timer to the peripheral_subsystem_high_res_timer<br />
component.<br />
<strong>Profiling</strong> <strong>Nios</strong> <strong>II</strong> <strong>Systems</strong> July 2011 <strong>Altera</strong> Corporation
Conclusion Page 17<br />
Conclusion<br />
12. Generate your BSP project and exit.<br />
13. Right click your project in the Project Explorer view, point to Build Project.<br />
14. To run the profiler_performance_counter software, right click your application<br />
project, point to Run As and click <strong>Nios</strong> <strong>II</strong> Hardware.<br />
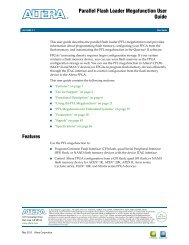
Figure 4 shows the <strong>Nios</strong> <strong>II</strong> Console output after running<br />
profiler_performance_counter. The data are similar to the command-line example in<br />
Figure 3. For more information, refer to “Analyzing the Performance Counter<br />
Report”.<br />
Figure 4. Performance Counter Report on <strong>Nios</strong> <strong>II</strong> Console<br />
Analyzing the Performance Counter Report<br />
The information in this section is applicable to the performance counter report that<br />
the command line or the <strong>Nios</strong> <strong>II</strong> SBT for Eclipse generates.<br />
pc_overhead is the performance counter component overhead due to a single call to<br />
the PERF_BEGIN macro. This number includes the overhead of executing the<br />
PERF_BEGIN macro and the corresponding PERF_END macro for this measured<br />
section.<br />
ts_overhead is the timestamp overhead—the overhead of a single function call to<br />
read the timer. This number includes the performance counter overhead to implement<br />
the measurement.<br />
The <strong>Nios</strong> <strong>II</strong> development environment provides several tools to analyze the<br />
performance of your project. The software-only GNU profiler approach adds minimal<br />
overhead. To analyze deterministic real-time performance issues, you can use a<br />
hardware timer or a performance counter. To choose the best tool for your task,<br />
consider the problem that you are solving.<br />
July 2011 <strong>Altera</strong> Corporation <strong>Profiling</strong> <strong>Nios</strong> <strong>II</strong> <strong>Systems</strong>
Page 18 Troubleshooting<br />
Troubleshooting<br />
The following sections describe several problems that might occur, and suggest ways<br />
to troubleshoot the problems.<br />
nios2-elf-gprof –annotated-source Switch Has No Effect<br />
The profiler does not track the basic-block-count information, so switches (such<br />
as the –annotated-source switch) do not work.<br />
Writing to the Registers of a Nonexistent Section Counter<br />
The performance counter report in Example 3 shows what happens when you<br />
attempt to use a nonexistent section counter of the performance counter component.<br />
Example 3. Result of Using a Nonexistent Section Counter<br />
--Performance Counter Report--<br />
Total Time: 5.78751 seconds (289375582 clock-cycles)<br />
+--------------------+--------+-------------+---------------+-----------+<br />
| Section | % | Time (sec) | Time (clocks) |Occurrences|<br />
+--------------------+--------+-------------+---------------+-----------+<br />
|sleep_tests | 49.4| 2.86162| 143081026| 1|<br />
+--------------------+--------+-------------+---------------+-----------+<br />
|perf_begin_overhead | 7.6e-06| 0.00000| 22| 1|<br />
+--------------------+--------+-------------+---------------+-----------+<br />
|timestamp_overhead | 7.6e-06| 0.00000| 22| 1|<br />
+--------------------+--------+-------------+---------------+-----------+<br />
|non_existent_counter|6.37e+12|368934881474.19104| -1| 4294967295|<br />
+--------------------+--------+-------------+---------------+-----------+<br />
Assume a fourth section counter specifies a performance counter component that<br />
Qsys defines to have three section counters only (the default value).<br />
In Example 3, the test is performed on a hardware design that does not have any other<br />
component defined with registers mapped immediately after the registers of the<br />
performance counter component. Therefore, there is no impact to other component.<br />
Depending on how you configure the component register base addresses in Qsys for a<br />
particular hardware design, unpredictable system behavior could occur.<br />
Output From a printf() or perf_print_formatted_output() Call Near the End<br />
of main() Might Be Prematurely Truncated<br />
This issue occurs when the <strong>Nios</strong> <strong>II</strong> application executes a BREAK instruction to<br />
transfer profiling data to the development workstation during the exit() or<br />
return() from main().<br />
As a workaround, call usleep(500000) before exiting or returning from main().<br />
This call creates an adequate delay for you to transmit the I/O to the JTAG UART<br />
before main returns (or calls exit()). If the output is still partially truncated,<br />
increase the delay value passed to usleep(). Use #include for the<br />
usleep() function prototype.<br />
<strong>Profiling</strong> <strong>Nios</strong> <strong>II</strong> <strong>Systems</strong> July 2011 <strong>Altera</strong> Corporation
Further Reading Page 19<br />
Fitting a Performance Counter in a Hardware Design That Consumes Most<br />
of a Device's Resources<br />
During development, you can measure the system in a larger device than the size of<br />
your device in a deployed system.<br />
Configure a performance counter to have only one section counter to save the most<br />
resources.<br />
The Histogram for the gmon.out File Is Missing, Even Though My main()<br />
Function Terminates<br />
Further Reading<br />
If you do not define a system timer for the system, the profiler does not call the<br />
nios2_pcsample() function, and does not generate the histogram for the<br />
gmon.out. Define a system timer for your system.<br />
f For information about the GNU profiler, refer to the <strong>Nios</strong> <strong>II</strong> GNU profiler<br />
documentation, included with the GCC documentation, available at the <strong>Nios</strong> <strong>II</strong><br />
Embedded Design Suite Support.<br />
f Because <strong>Altera</strong> has rewritten the lib-gprof library, the information in this<br />
application note about data collection deviates from <strong>Altera</strong>’s<br />
implementation.<br />
f For information about the performance counter, refer to the Performance Counter Core<br />
chapter in the Embedded Peripherals IP User Guide. For information about the<br />
high-speed timer, refer to the Timer Core chapter in the Embedded Peripherals IP User<br />
Guide.<br />
July 2011 <strong>Altera</strong> Corporation <strong>Profiling</strong> <strong>Nios</strong> <strong>II</strong> <strong>Systems</strong>
Page 20 Document Revision History<br />
Document Revision History<br />
Table 1. Document Revision History<br />
Table 1 shows the revision history for this application note.<br />
Date Version Changes<br />
July 2010 3.0<br />
May 2010 2.0<br />
July 2008 1.3<br />
This revision incorporates the following changes:<br />
■ Replaced mentions of SOPC Builder with Qsys.<br />
■ Updated “Obtaining the Hardware Design” on page 1, “Obtaining the Software Examples”<br />
on page 1, “Program Counter Trace Information” on page 4, “Tutorial: Using the GNU<br />
Profiler” on page 7, “Creating the Profiler Software Example” on page 7, “Creating the<br />
GNU Profiler Report” on page 8, “Creating and Running the Profiler Software Example”<br />
on page 9“Analyzing the GNU Profiler Report” on page 10“Flat Profile and Call Graph<br />
Example” on page 11, “Modifying the <strong>Nios</strong> <strong>II</strong> Hardware Design” on page 14, “Creating the<br />
Performance Counter Software Example” on page 15, “Running the Performance Counter<br />
Software Example” on page 15, and “Performance Counter Example with <strong>Nios</strong> <strong>II</strong> SBT for<br />
Eclipse” on page 16.<br />
This revision incorporates the following changes:<br />
■ Updated document, software and screen shots for the <strong>Nios</strong> <strong>II</strong> SBT for Eclipse<br />
■ Added the <strong>Nios</strong> <strong>II</strong> SBT for Eclipse flow<br />
■ Updated examples for the NEEK<br />
This revision incorporates the following changes:<br />
■ Updated document for the Quartus <strong>II</strong> software and <strong>Nios</strong> <strong>II</strong> EDS v8.0.<br />
■ Replaced references to the <strong>Nios</strong> <strong>II</strong> IDE with instructions in the <strong>Nios</strong> <strong>II</strong> software build flow.<br />
■ General updates for the Quartus <strong>II</strong> software v8.0.<br />
February 2006 1.2 Updated document for the Quartus <strong>II</strong> software and <strong>Nios</strong> <strong>II</strong> EDS v5.1 SP1.<br />
November 2005 1.1 Updated document for the Quartus <strong>II</strong> software and <strong>Nios</strong> <strong>II</strong> EDS v5.1.<br />
August 2005 1.0 Initial release.<br />
<strong>Profiling</strong> <strong>Nios</strong> <strong>II</strong> <strong>Systems</strong> July 2011 <strong>Altera</strong> Corporation