

GPR for river dyke - GSB
GPR for river dyke - GSB
GPR for river dyke - GSB

Create successful ePaper yourself
Turn your PDF publications into a flip-book with our unique Google optimized e-Paper software.
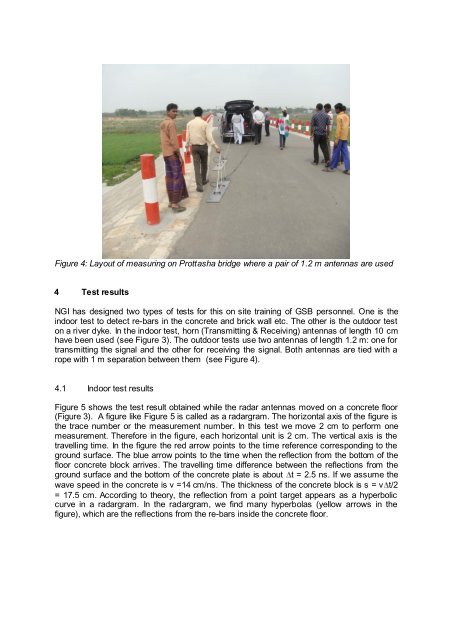
Figure 4: Layout of measuring on Prottasha bridge where a pair of 1.2 m antennas are used<br />
4 Test results<br />
NGI has designed two types of tests <strong>for</strong> this on site training of <strong>GSB</strong> personnel. One is the<br />
indoor test to detect re-bars in the concrete and brick wall etc. The other is the outdoor test<br />
on a <strong>river</strong> <strong>dyke</strong>. In the indoor test, horn (Transmitting & Receiving) antennas of length 10 cm<br />
have been used (see Figure 3). The outdoor tests use two antennas of length 1.2 m: one <strong>for</strong><br />
transmitting the signal and the other <strong>for</strong> receiving the signal. Both antennas are tied with a<br />
rope with 1 m separation between them (see Figure 4).<br />
4.1 Indoor test results<br />
Figure 5 shows the test result obtained while the radar antennas moved on a concrete floor<br />
(Figure 3). A figure like Figure 5 is called as a radargram. The horizontal axis of the figure is<br />
the trace number or the measurement number. In this test we move 2 cm to per<strong>for</strong>m one<br />
measurement. There<strong>for</strong>e in the figure, each horizontal unit is 2 cm. The vertical axis is the<br />
travelling time. In the figure the red arrow points to the time reference corresponding to the<br />
ground surface. The blue arrow points to the time when the reflection from the bottom of the<br />
floor concrete block arrives. The travelling time difference between the reflections from the<br />
ground surface and the bottom of the concrete plate is about t = 2.5 ns. If we assume the<br />
wave speed in the concrete is v =14 cm/ns. The thickness of the concrete block is s = v t/2<br />
= 17.5 cm. According to theory, the reflection from a point target appears as a hyperbolic<br />
curve in a radargram. In the radargram, we find many hyperbolas (yellow arrows in the<br />
figure), which are the reflections from the re-bars inside the concrete floor.