11DIFFERENTIATION - Department of Mathematics
11DIFFERENTIATION - Department of Mathematics
11DIFFERENTIATION - Department of Mathematics

You also want an ePaper? Increase the reach of your titles
YUMPU automatically turns print PDFs into web optimized ePapers that Google loves.
Using Technology<br />
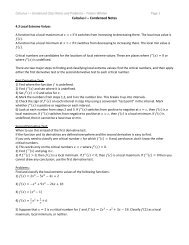
FIGURE T1<br />
702<br />
EXAMPLE 1<br />
F INDING THE R ATE OF C HANGE OF A F UNCTION<br />
We can use the numerical derivative operation <strong>of</strong> a graphing utility to obtain<br />
the value <strong>of</strong> the derivative at a given value <strong>of</strong> x. Since the derivative <strong>of</strong> a<br />
function f(x) measures the rate <strong>of</strong> change <strong>of</strong> the function with respect to x,<br />
the numerical derivative operation can be used to answer questions pertaining<br />
to the rate <strong>of</strong> change <strong>of</strong> one quantity y with respect to another quantity x,<br />
where y f(x), for a specific value <strong>of</strong> x.<br />
Let y 3t 3 2t.<br />
a. Use the numerical derivative operation <strong>of</strong> a graphing utility to find how<br />
fast y is changing with respect to t when t 1.<br />
b. Verify the result <strong>of</strong> part (a), using the rules <strong>of</strong> differentiation <strong>of</strong> this section.<br />
SOLUTION ✔ a. Write f(t) 3t3 2t. Using the numerical derivative operation <strong>of</strong> a<br />
graphing utility, we find that the rate <strong>of</strong> change <strong>of</strong> y with respect to t when<br />
t 1 is given by f(1) 10.<br />
b. Here, f(t) 3t3 2t1/2 and<br />
f(t) 9t 2 21 2 t1/2 9t 2 1<br />
t<br />
Using this result, we see that when t 1, y is changing at the rate <strong>of</strong><br />
f(1) 9(12 ) 1<br />
10<br />
1<br />
units per unit change in t, as obtained earlier. <br />
EXAMPLE 2<br />
SOLUTION ✔<br />
According to the U.S. <strong>Department</strong> <strong>of</strong> Energy and the Shell Development<br />
Company, a typical car’s fuel economy depends on the speed it is driven and<br />
is approximated by the function<br />
f(x) 0.00000310315x 4 0.000455174x 3<br />
0.00287869x 2 1.25986x (0 x 75)<br />
where x is measured in mph and f(x) is measured in miles per gallon (mpg).<br />
a. Use a graphing utility to graph the function f on the interval [0, 75].<br />
b. Find the rate <strong>of</strong> change <strong>of</strong> f when x 20 and x 50.<br />
c. Interpret your results.<br />
Source: U.S. <strong>Department</strong> <strong>of</strong> Energy and the Shell Development Company<br />
a. The result is shown in Figure T1.<br />
b. Using the numerical derivative operation <strong>of</strong> a graphing utility, we see that<br />
f(20) 0.9280996. The rate <strong>of</strong> change <strong>of</strong> f when x 50 is given by<br />
f(50) 0.314501.<br />
c. The results <strong>of</strong> part (b) tell us that when a typical car is being driven at<br />
20 mph, its fuel economy increases at the rate <strong>of</strong> approximately 0.9 mpg<br />
per 1 mph increase in its speed. At a speed <strong>of</strong> 50 mph, its fuel economy<br />
decreases at the rate <strong>of</strong> approximately 0.3 mpg per 1 mph increase in<br />
its speed.