

Spatial dynamics of teak defoliator (Hyblaea puera Cramer) - Cochin ...
Spatial dynamics of teak defoliator (Hyblaea puera Cramer) - Cochin ...
Spatial dynamics of teak defoliator (Hyblaea puera Cramer) - Cochin ...

Create successful ePaper yourself
Turn your PDF publications into a flip-book with our unique Google optimized e-Paper software.
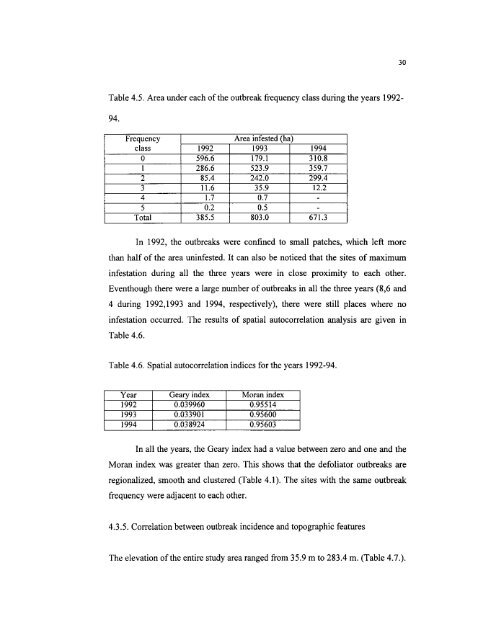
Table 4.5. Area under each <strong>of</strong>the outbreak frequency class during the years 1992-<br />
94.<br />
Frequency Area infested (ha)<br />
class 1992 1993 1994<br />
0 596.6 179.1 310.8<br />
1 286.6 523.9 359.7<br />
2 85.4 242.0 299.4<br />
3 11.6 35.9 12.2<br />
4 1.7 0.7 -<br />
5 0.2 0.5 -<br />
Total 385.5 803.0 671.3<br />
In 1992, the outbreaks were confined to small patches, which left more<br />
than half <strong>of</strong> the area uninfested. It can also be noticed that the sites <strong>of</strong> maximum<br />
infestation during all the three years were in close proximity to each other.<br />
Eventhough there were a large number <strong>of</strong> outbreaks in all the three years (8,6 and<br />
4 during 1992,1993 and 1994, respectively), there were still places where no<br />
infestation occurred. The results <strong>of</strong> spatial autocorrelation analysis are given in<br />
Table 4.6.<br />
Table 4.6. <strong>Spatial</strong> autocorrelation indices for the years 1992-94.<br />
Year Geary index Moran index<br />
1992 0.039960 0.95514<br />
1993 0.033901 0.95600<br />
1994 0.038924 0.95603<br />
In all the years, the Geary index had a value between zero and one and the<br />
Moran index was greater than zero. This shows that the <strong>defoliator</strong> outbreaks are<br />
regionalized, smooth and clustered (Table 4.1). The sites with the same outbreak<br />
frequency were adjacent to each other.<br />
4.3.5. Correlation between outbreak incidence and topographic features<br />
The elevation <strong>of</strong>the entire study area ranged from 35.9 m to 283.4 m. (Table 4.7.).<br />
30


